Dep Science Leader of Palaeo Environments IMP 3
BAS Science Strategy Executive Group, Palaeo Environments, Ice Sheets and Climate Change team
Because water attenuates light rapidly, we need to rely on something other than sight to visualise the underwater world. The RRS Sir David Attenborough has a range of state-of-the-art acoustic instruments for visualising features both in the water and in the seabed.
This includes:
*These units do not have ice protection and therefore can’t be deployed while operating in ice.
With so many acoustic instruments on board it is important that they don’t interfere with each other. The RRS Sir David Attenborough has a synchronisation unit which acts as the ‘conductor’ of all the instruments, allowing researchers to optimise data collection.
The MS70 fisheries multibeam sonar will be used to look at the 3D structure of Antarctic krill swarms. It will create a 3D image using 500 beams comparison of 20 layered horizontal fans.
The ship is also fitted with a farsounder forward looking sonar which warns of navigational hazards under the water, such as uncharted rocks, making carrying out research in new, unsurveyed areas much safer. Although many ships have these sonars, they are usually integrated within its structure. This isn’t possible on the Sir David Attenborough as the sonar would be damaged by ice. Instead, the farsounder has been fitted on a retractable pole and will only be deployed when the ship isn’t ice breaking.
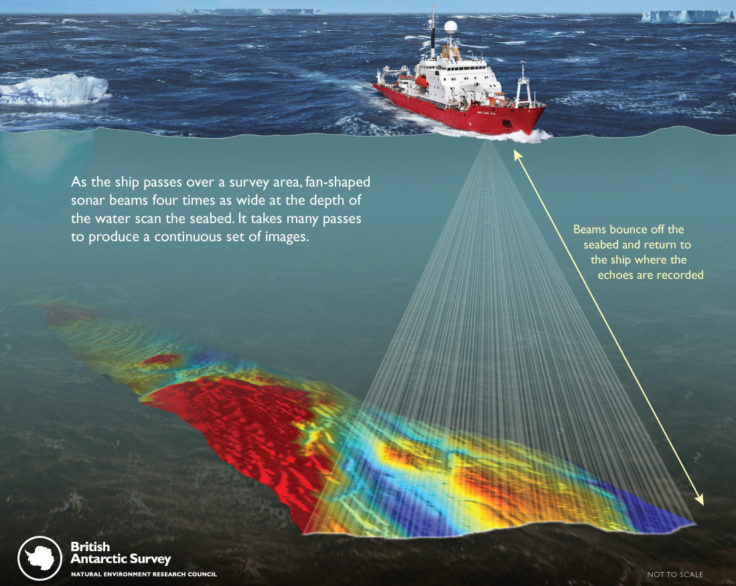
Echo sounding has been used to determine water depth in ship navigation for decades. The ship emits a single underwater acoustic pulse which travels through the water and is reflected by the seabed. By measuring how long it takes for the pulse to return to the ship, mariners can calculate how deep the water under the ship is. Scientists can use these same acoustic pulses to find out more about the shape and topography of the seafloor – known as bathymetry.
Multibeam echo sounders sends out hundreds of acoustic pulses at different angles, creating a swath of information on water depth which can be used to create a map of the seafloor. Multibeam echo sounders on board a ship can usually map an area about four times as wide as the water depth. For example, if the ship is in 1km deep water then it could map a 4km wide swath of the seafloor. Often, the ship will sail back and forth in parallel lines to map a larger area.
However, this data cannot always capture the finer topographic details of the seabed. As robotic and submarine technologies become more refined, researchers are increasingly using remotely operated vehicles (ROVs) and automatic underwater vehicles (AUVs) to carry multibeam echo sounders far below the surface. From here, they can map a narrower swath of the seafloor but at a much higher resolution. They can also access areas that ships cannot reach, such as the underside of floating ice shelves and the front of glaciers, where large icebergs may break off at any time. Using these technologies, scientists can build a more comprehensive, accurate picture of the seafloor.
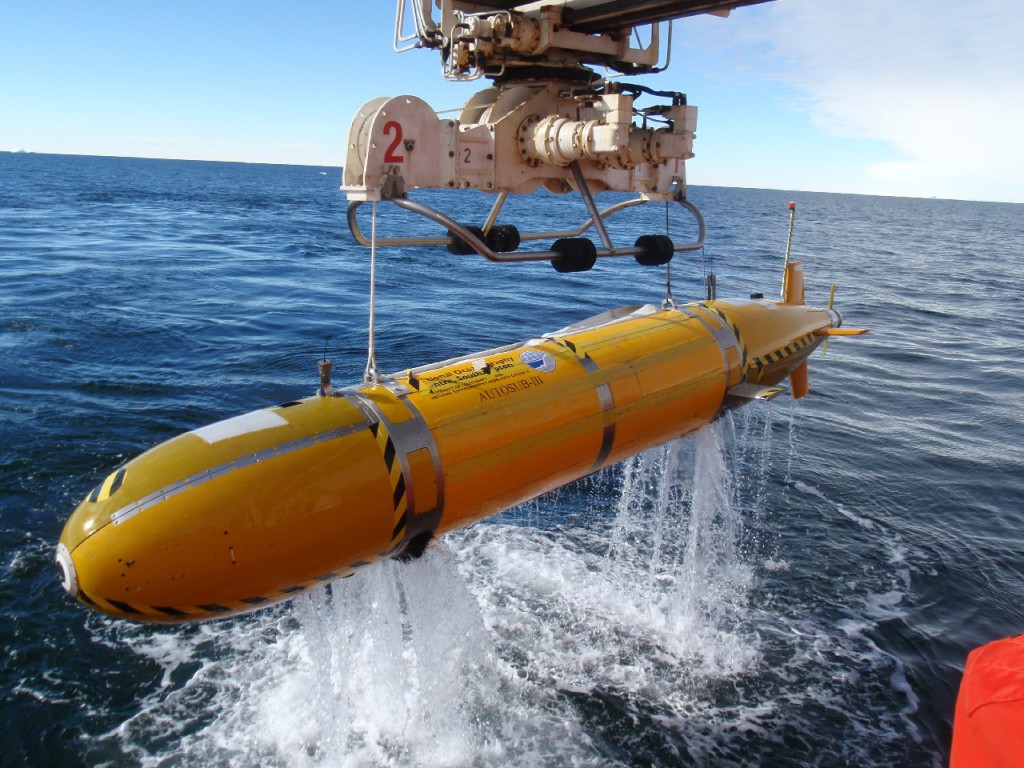
The AUV ‘Seabed’ being deployed from RRS James Clark Ross
For the highly accurate calculations required for scientific purposes, the exact speed of sound in the waters under the ship can be measured using a sound velocity probe.
Scientists can use the resulting seabed maps for a variety of purposes, from mapping the habitats of different animal groups to calculating the flow of ocean currents and studying how glaciers moved over the ocean floor in the past.
Marine geologists use the maps to find the best sites for taking sediment cores, and to study how glaciers once moved over the coastal areas off Antarctica and the Arctic. Several BAS scientists have used swath bathymetry – both on ships and on AUVs – to explore the depths of the Southern Ocean.
Oceanographers who study the flow of ocean currents use bathymetry maps to understand the exact shape of the ocean basins that they are modelling. This means they can calculate the flow of currents more accurately, particularly in shallower waters. In the Amundsen Sea Embayment, BAS researchers studying the shape of the seafloor found evidence of the long-term melt history of the Pine Island Glacier. This data helped them interpret the current rapid retreat and melting of the glacier – currently one of the biggest contributors to Antarctic ice mass loss.
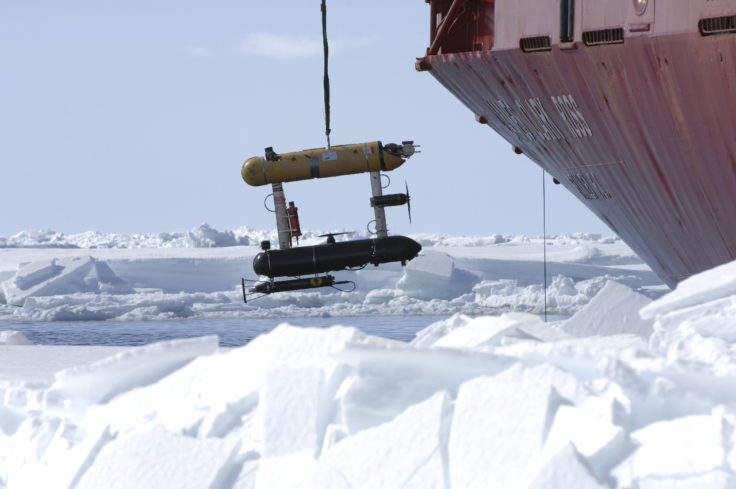
AUTOSUB 3 autonomous underwater vehicle being retrieved after observational missions beneath the floating tongue of Pine Island Glacier.
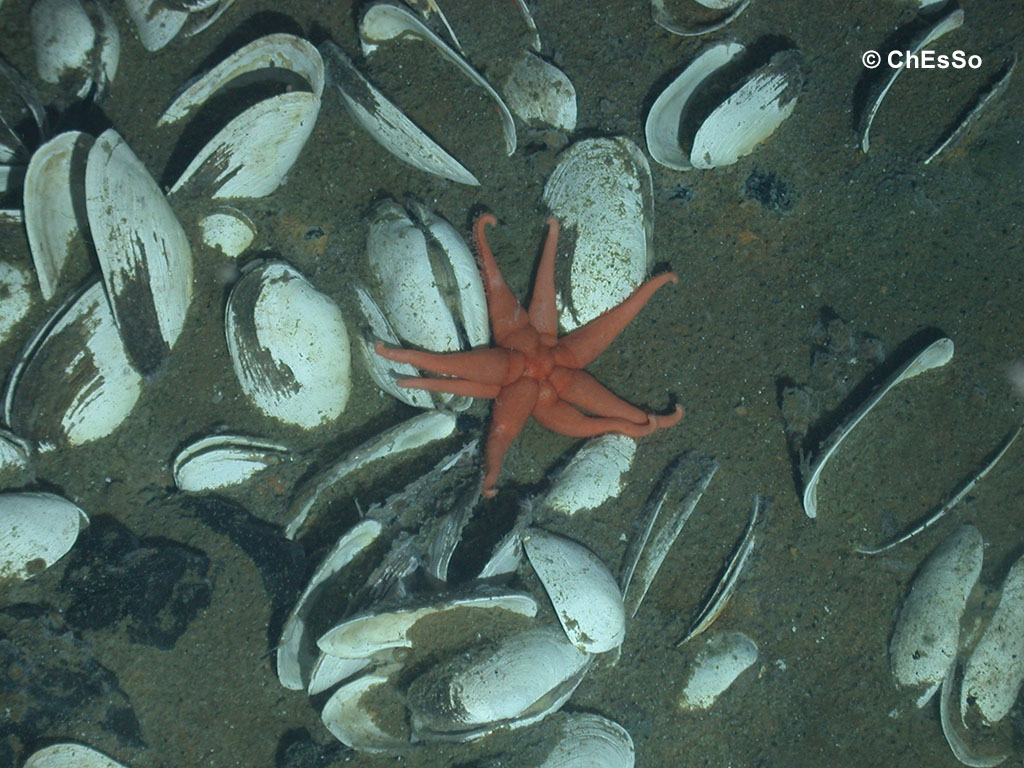
Marine biologists can use bathymetry data to map wildlife habitats. Scientists at BAS were involved with a study that discovered the first ever deep-sea hydrothermal vents found in the Southern Ocean. These vents, where temperatures can reach more than 300°C, are devoid of light but rich in chemicals that help sustain an ecosystem unlike any other on Earth. This information is an important tool used to define fishing areas in places like South Georgia in order to avoid overfishing.
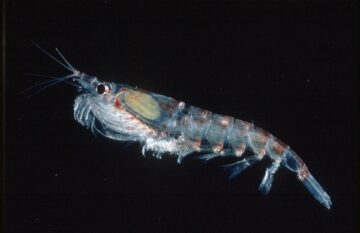
Marine biologists can also use acoustic techniques can also be used to locate schools of fish, whales and other species living at different depths underwater. Acoustic signals sent into the water by the transducer are reflected by individuals or groups of animals, allowing for biomass estimation. The multi-frequency echosounders aboard RRS Sir David Attenborough will allow for the identification of different species.
Finally, much of the Southern Ocean is very poorly surveyed and ships frequently travel through previously uncharted waters. As a result, there is often an element of discovery in swath bathymetry measurements, which can even help in producing new nautical charts.
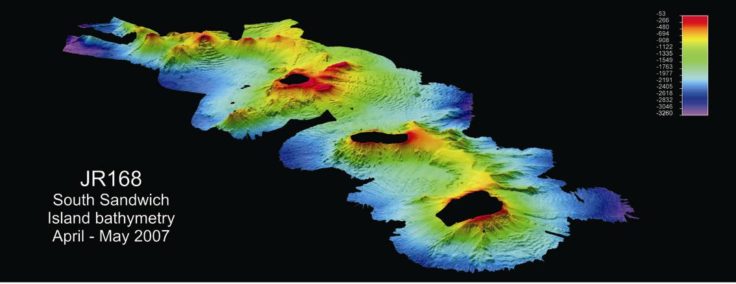
An example of a seafloor map created using swath bathymetry off the South Sandwich Islands.
Dep Science Leader of Palaeo Environments IMP 3
BAS Science Strategy Executive Group, Palaeo Environments, Ice Sheets and Climate Change team
Zooplankton Ecologist
CONSEC explores how climate change and human activity are transforming the Southern Ocean, guiding global science and conservation.