Director of Innovations and Impact
BAS Science Strategy Executive Group, Information Services team, Leadership teams, UK Polar Data Centre team, BAS Executive team

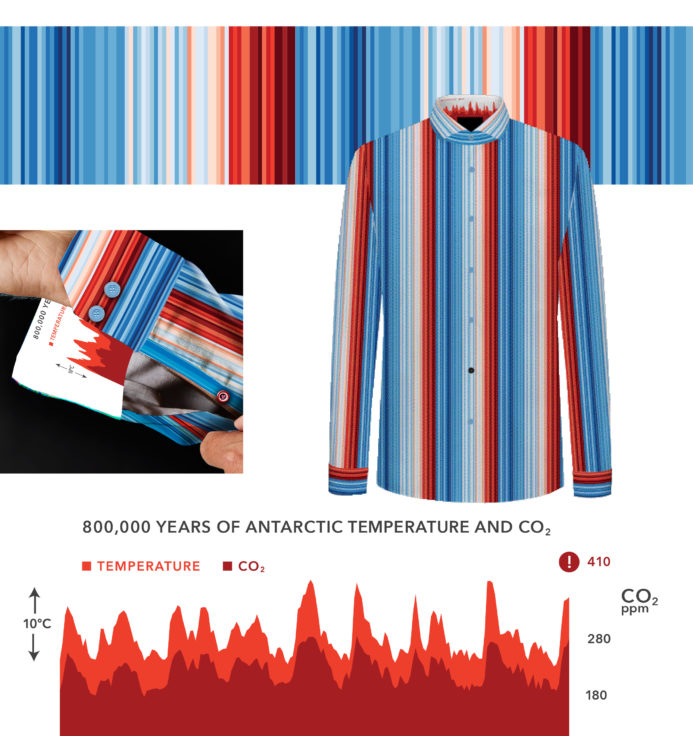
The Climate Code shirt has been used extensively at BAS over the last 5 years to illustrate the amplification of climate change in the polar regions, and the unprecedented rise of greenhouse gas emissions in 800,000 years of global history.
In talks where we use the shirt to tell this story, we continuously update both the climate stripe graphics for the Arctic, and the CO2 concentrations, which have risen by over 20ppm since we originally designed the shirt.
The shirt was at the centre of a TEDx talk given in April 2026 as part of TEDxPunta Arenas 2026:
In April 2020, as we were all finding ways of adjusting to home-working, the Innovation Team ran one of the first online talks or “Knowledge Snack” sessions on Novel Ways of Visualising Environmental Data. The talks by BAS Environmental Data Scientist Scott Hosking and Andy Boothman, founder of the Cambridge-based, data-inspired company called DressCode Shirts sparked a lot of interest in a collaborative project. Following the session, BAS Climate Model Data and Analysis Software Manager Tony Phillips kindly offered to collate the first selection of datasets that could be used to create a shirt with designs inspired by environmental data. With the support of the Innovation Team and climate scientists John Turner, Gareth Marshall, Robert Mulvaney (all BAS), Eric Wolff (Uni Cambridge) and Ed Hawkins (NCAS/Uni Reading), Tony and Andy started working on different designs and narrowed down the datasets based on the potential to tell the science story through the shirt’s design.
The climate of the earth and what we do to it over the coming years and decades is pivotal to everybody’s way of life. This is a global issue and we all have a part to play, but it can also feel like an abstract thing, outside of many peoples’ personal experience and understanding. Glacial melt and rising seas levels are just one aspect of the complex, interconnected system that we live in. Many people struggle to connect with what this means – this was the catalyst for a unique collaboration.
We have now combined key data about the warming trends of the polar regions to create a shirt that showcases the changes scientists have discovered, in an aesthetically intriguing way. Not only is the shirt a novel platform for visualising complex data, but also for storytelling. The design introduces several layers of detail, showing recent Arctic warming through the main fabric and offering Antarctic long-term climate perspectives through the reveals on cuffs and collars, down to unearthing the link between Antarctic climate and the ozone hole through a symbolic black button.
Listen to our Director of Innovation & Impact, Beatrix Schlarb-Ridley, describe the design elements and the science behind them in the below video interview:
Warming within the Arctic Circle, 1950-2020

The main fabric of the shirt shows a repeat of the ‘warming stripes’ visualising temperature increases within the Arctic Circle between 1950 and 2020. The data set used is ERA5, and the colour coding follows that of Ed Hawkins’ famous global warming stripes.
“We’re seeing the consequences of global warming in the warming of the Arctic. It’s the natural world telling us that something is happening, and the 40% reduction in Arctic sea ice, which also affects global sea level rise, is just one of the responses to the changes we are pushing on our planet. The IPCC attributes global warming to the greenhouse gases we are emitting to the atmosphere, especially CO2 and methane. If we are to limit global warming to 1.5 degrees which could still have a stabilising effect on our climate, we need to reduce all of the greenhouse gases and reach Net Zero Carbon with urgency no later than 2050.”—Ed Hawkins, Reading University and the National Centre of Atmospheric Science
800,000 years of climate history from Antarctic ice cores – we are in uncharted territory
 Ice cores drilled in Antarctica offer a unique insight into the climate history of our planet: they have allowed us to measure temperature and the concentration of greenhouse gases such as CO2 over the last 800,000 years. In all this time, through cold glacial periods and warm interglacials, changes in CO2 and temperature have gone hand in hand. The CO2 concentration has never risen above 300ppm – it has largely stayed between 180ppm and 280ppm, and average Antarctic temperatures have ranged between the present day average, and 9°C colder in the glacial periods. This is depicted on the reveals of the cuffs and collar of the shirt. At the time of the design of the shirt graphics, global CO2 concentration was at 410ppm – at COP26, it has reached 415ppm. This is far higher than our planet has seen for the last 800,000 years, and the rapid increase in CO2, symbolised by the red dot on the graphic, means we are in uncharted territory.
“When we drill into the Antarctic ice sheet we’re effectively drilling into the past through ice that has built up year upon year upon year. By picking the right drilling location, we’re able to reach back tens or even hundreds of thousands of years and bring together a record of the climate and the atmosphere and see how the two interact. I’ve worked on ice cores that go back as far as 800 000 years and, in that time, we’ve cycled through a cold glacial period and warm interglacial period eight times. In each of those global climate cycles, the CO2 drops during a cold period to around 180ppm, and as the climate warms up it increases to about 280ppm, just like we see in the beginning of the Industrial Revolution. Then, as the Industrial Revolution takes hold, CO2 begins to rise all the way to the level today of 415ppm, and it continues to rise around 2-3ppm every year.
I was born into a world where the level of CO2 was 315ppm; today it’s 415ppm. It’s gone up by nearly a third in my lifetime. We are asking people that they think about the fact that CO2 is increasing and the fact that we’re all contributing to that in the way we live and eat and travel. We all contribute to the levels of CO2 in the atmosphere which is causing things to warm, which is also causing the global climate to warm, and which is impacting the polar ice caps with increasing melt adding to sea level rise, and that’s another aspect of climate change that we really want to avoid over the next century.”—Robert Mulvaney, British Antarctic Survey
Want to read more about modern day CO2levels?
Differences between the Arctic and Antarctic – the role of the Ozone hole

BAS Director of Innovation and Impact Beatrix Schlarb-Ridley wearing the first sample of the Climate Code shirt
Global warming has led to accelerated ice loss from Antarctic ice sheets, and contributes significantly to global sea level rise. Many of the most rapid changes have been caused by the warming ocean around Antarctica – air temperatures in the Antarctic have not risen by the amount observed in the Arctic. Why is this the case? The astounding cause lies in the ozone hole: it has changed weather patterns which have delayed the impact of greenhouse gas increases on the climate of the continent.
“For me the most astonishing evidence is the way that one man-made environmental factor — the ozone hole — has shielded most of Antarctica from another — global warming. Understanding the complexities surrounding these issues is a challenge for scientists — and communicating these in a meaningful way to society and to policymakers is essential. There is no doubt that our world is changing and human activity is accelerating global change.” —Professor John Turner, British Antarctic Survey, lead editor of the Antarctic Climate Change and the Environment review
Project aims: Reaching new audiences – Conversation starters – Novel environmental data visualisation
One of the many questions we ask ourselves here at the British Antarctic Survey is “how do we increase the impact of our science, and communicate it efficiently to new audiences, so we can address issues of global importance, and help society adapt to a changing world?” The main aim of this project was to draw attention to the evidence about global warming and the proven link to increases in atmospheric CO2 concentrations. We did careful consideration in crafting the final design that portrays various elements of the Earth’s climate system and records.
The Climate Code shirt features two main datasets – the warming stripes of the shirt fabric represent the last 70 years of temperature records from the Arctic, with reveal details providing the backdrop of 800,000 years of Antarctic temperature- and CO2-data. The innovative design brings together the dynamic story of the past and the worrying trends of the present in a novel visualisation which aims to inspire climate action.
The main elements of this science story are:
Our design brings all this scientific data and knowledge together, and explores the unique connections that highlight the unprecedented nature of our current changes in climate and atmospheric CO2.
Above are the combined key design elements of the Climate Code shirt.
Director of Innovations and Impact
BAS Science Strategy Executive Group, Information Services team, Leadership teams, UK Polar Data Centre team, BAS Executive team
Senior Climatologist
Science Programme Coordinator
Impact Facilitator

Andy Boothman, Founder and creative director of DressCode Shirts

Professor Ed Hawkins, University of Reading & National Centre for Atmospheric Science (NCAS)
The Innovation Showcase explains how innovative science and technology is helping or, in future, could substantially help the goals of COP26 and of reducing greenhouse gas emissions, enabling adaptation to climate change or informing action related to climate change.
The Aurora Collaboration Space at British Antarctic Survey is a coworking space for members who share our passion for the environment.

The Aurora Innovation Centre offers a space and support services for interdisciplinary collaboration to tackle environmental challenges and increase real-world benefit of polar research.