Biodiversity
A Graph-Based Framework for Ecosystem Fragmentation from Remote Sensing Data
Fragmentation occurs when parts of a habitat are lost due to for example change of land use, leaving behind smaller unconnected areas. This makes survival of the species of the habitat more challenging leading potentially to a reduction in biodiversity.
The Importance
Tom Dowling from the UN Environment Programme World Conservation Monitoring Centre and the National Centre for Earth Observation describes the importance of the project “Ecosystem fragmentation is a vital component of protected area planning and conservation- yet it is a phenomenon that is very hard to consistently measure over large areas in a sustainable and cost-effective manner. The combination of AI and satellite observations provides an opportunity for us to provide policy makers and protected area managers with near real time monitoring and planning tools that will lead to better outcomes at both the ecosystem and species scale.”
Adham Ashton-Butt from the British Trust for Ornithology adds “If we are to tackle the global biodiversity crisis by restoring our damaged habitats, we need to move from an opportunistic and scattergun approach, to using evidence-based, targeted methods over large scales. The use of AI and satellite data could be a vital tool to identify priority areas for restoration, and critically evaluate successes and failures of conservation projects.”
The Solution
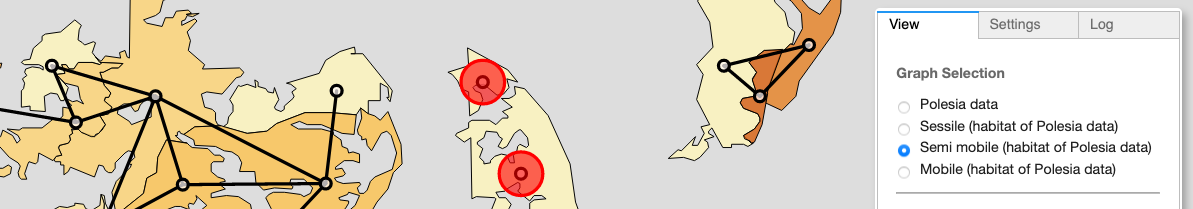
Available landcover maps do not capture habitats in their rich variety, because they were often built for other purposes. For different species different landcovers are important. Therefore the first step is to build a customizable landcover classification tool. To assess fragmentation current approaches fail to sufficiently capture the complexity of habitat configurations, connectivity and their temporal dynamics. These shortcomings are addressed by a georeferenced graph-based framework. It can track individual habitats over time, test connectivity between different habitat areas by taking into account the distance a species can travel. The analysis can be rerun quickly for changed parameters. Standard metrics are calculated in addition to novel metrics.
The Video
The Code
The code repository contains a binder link which enables you to run a demonstration in a web browser without installing anything locally. This is accompanied by documentation. The Pip package can be installed by ‘pip install geograph’

The Data
The data used were:
- Landsat 5, 7 and 8,
- Sentinel-2,
- ESA CCI land cover data,
- Polesia habitat data, created by Dmitri Grummo, for the Endangered Landscapes Program, funded by Arcadia, a charitable fund of Lisbet Rausing and Peter Baldwin.
The Team
This project was undertaken by Herbie Bradley, Arduin Findeis, Katherine Green, Yilin Li, Simon Mathis, Simon Thomas.
The Partners
 |
 |