A new map of the seafloor of the Southern Ocean surrounding Antarctica provides the most accurate representation of this vast area to date.
An international team of scientists, including several from British Antarctic Survey, worked on the map which covers 48 million km2, an area roughly five times the size of Canada. The map shows features including canyons, mountains and plains, and even identifies a new deepest point – a 7,432m trench called the Factorian Deep.
The International Bathymetric Chart of the Southern Ocean (IBSCO) has taken five years to compile and update this map, which was first published in 2013. The updated map extends 10 degrees further north than the previous map, and now covers an area 2.4 times larger than the original. To get an idea of how detailed the map is, if you divide the map into 500m grid squares, 23% of these cells now have at least one modern depth measurement.
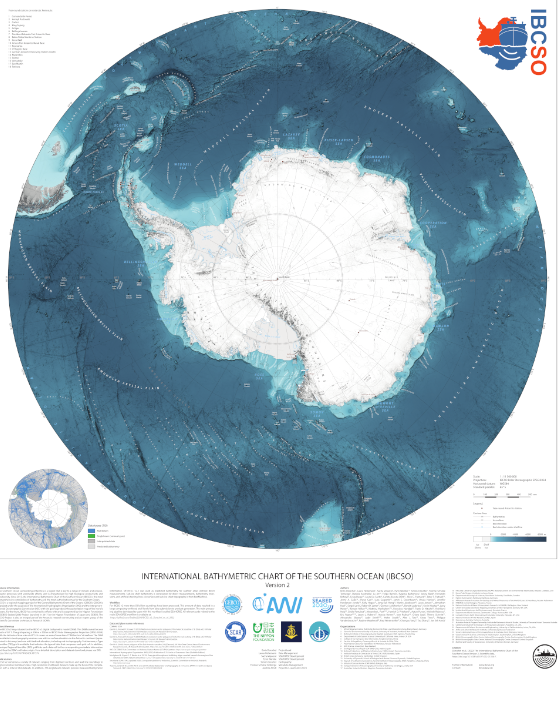
The digital bathymetric model (DBM) of IBCSO Version 2 has a 500m x 500m resolution based on a polar stereographic projection (EPSG: 9354) for the area south of 50°S. I
The map was drawn by compiling measurements taken by ships conducting research in and around Antarctica, in a process called bathymetry. This includes British Antarctic Survey’s former ship RRS James Clark Ross. BAS contributed mapping data from more than 100 cruises, including new data from the Scotia Sea – an area covered frequently by BAS ships when travelling between the Falkland Islands, King Edward Point and Signy. In the future, RRS Sir David Attenborough will provide data to the project.
Improved maps of the seafloor are essential to safe navigation, protecting the marine environment and helping us understand Earth’s climate and geological history. Features of the ocean floor help determine how water masses and ocean currents move and how the affect are climate. Biodiversity is also influenced by seafloor landforms. Having precise information on the topography of the seafloor is therefore indispensable for oceanographic and climate research.
Rob Larter, Geophysicist at BAS and co-author of the map, says:
“This map has huge implications for scientific research. It will help us understand how the shape of the seafloor is affecting the paths of major ocean currents and the way the ocean water mixes, which affects how it transports heat and then influences temperatures around the world. This is a hugely important element for predicting climate change.”
The digital bathymetric model and a high-resolution map of the Southern Ocean are available for download free of charge at the project website www.ibcso.org and https://doi.org/10.1594/PANGAEA.937574.
The map, and the methods used to create it, were published in Nature journal Scientific Data this week. The International Bathymetric Chart of the Southern Ocean Version 2 is available here: https://doi.org/10.1038/s41597-022-01366-7