
A new map of what lies beneath the Greenland Ice Sheet is published this week (Thursday 14 December 2017). By providing scientists with the most comprehensive, high resolution and accurate picture of the bedrock and coastal seafloor, it reveals how the glaciers that drain from the Greenland Ice Sheet will contribute to future sea-level rise.
Produced by researchers at British Antarctic Survey (BAS), University of Bristol and University of California at Irvine (UCI), the printed map is unveiled this week at the American Geophysical Union meeting in New Orleans.
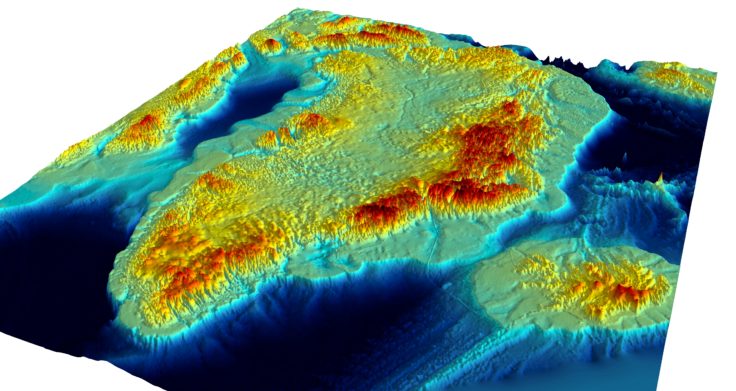
Greenland Basal Topography BedMachine v3 is published by British Antarctic Survey
“Greenland Basal Topography BedMachine v3” is the new 1:3,500,000 scale map created from data collected by over 30 institutions.
BAS cartographer Dr Peter Fretwell, who was involved in producing the printed map, says:
“This new compilation of the 3D landscape beneath the Greenland Ice Sheet provides the first seamless transition between the landmass and its adjoining seabed, and this gives scientists a bird’s eye view of the fringes of Greenland which are experiencing the most changes.
“What’s also surprising is that there is more ice and the bed is deeper in some places than previous maps suggest, so this means the total contribution from the ice sheet to global sea level rise would be 7.42 metres if it were to melt completely, slightly higher than previously calculated.”
The data required to compile the map was collected from many sources – from satellite, airborne and ground-based radar and seabed mapping from research ships.
Dr Mathieu Morlighem from UCI, who was funded by NASA and the National Science Foundation (NSF) and who was lead author on a recent paper that presented the data behind this map, says:
“It’s great to see our data being visualised in this way and being available to share it with other researchers. Ultimately, we hope this new map will help reduce the uncertainty in the predictions of the contribution of Greenland to sea level rise, as the bed topography controls how the glaciers retreat. There are still some areas such as fjords for which we need more measurements, so we will keep improving this map as more data become available.”
Glaciologist Prof Jonathan Bamber at University of Bristol who had a NERC-funded project to develop the printed map and data set says:
“It reveals that many glaciers that drain the Greenland ice sheet are thicker than previously estimated – up to 100 metres in places – it also shows they have complex fjord geometries that will control how they react to changes from the effects of warmer ocean currents. This map will improve our understanding of the ice-ocean interactions and how the ice sheet will evolve in a changing climate.”
ENDS
Issued by the Press Office at British Antarctic Survey:
Athena Dinar, Senior PR & Communications Manager, British Antarctic Survey, tel: +44 (0)1223 221 441; mobile: +44 (0)7909 008516; email: amdi@bas.ac.uk
Notes to Editors
Images and fly-throughs of the map and fieldwork on and around Greenland are available from the BAS Press Office (above).
The map “Greenland Basal Topography BedMachine v3”’ was funded through a grant from the Natural Environment Research Council via University of Bristol. It was co-produced by Chris Williams (now at British Geological Survey) and Peter Fretwell at BAS.
This new product provides for the first time the whole periphery of Greenland and its coastline up to 50kms.
The printed map is based on newly published data from an international consortium of over 30 research institutions. BedMachine v3: Complete bed topography and ocean bathymetry mapping of Greenland from multi-beam echo sounding combined with mass conservation by Morlighem, M., C. Williams, E. Rignot, L. An, J. E. Arndt, J. Bamber, G. Catania, N. Chauché, J. A. Dowdeswell, B. Dorschel, I. Fenty, K. Hogan, I. Howat, A. Hubbard, M. Jakobsson, T. M. Jordan, K. K. Kjeldsen, R. Millan, L. Mayer, J. Mouginot, B. Noël, C. O’Cofaigh, S. J. Palmer, S. Rysgaard, H. Seroussi, M. J. Siegert, P. Slabon, F. Straneo, M. R. van den Broeke, W. Weinrebe, M. Wood, and K. Zinglersen. 2017 was published in Geophysical Research Letters. 44. http://dx.doi.org/10.1002/2017GL074954
Data can be downloaded from: https://nsidc.org/data/IDBMG4
The map can be purchased from: www.stanfords.co.uk