E Fellow
Modelling Movement of Antarctic Krill
Modelling Movement of Antarctic Krill: the importance of retention, dispersal and behaviour for krill distribution
- Start date:
- 1 November, 2017
- End date:
- 31 December, 2018
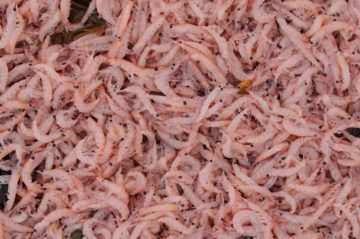
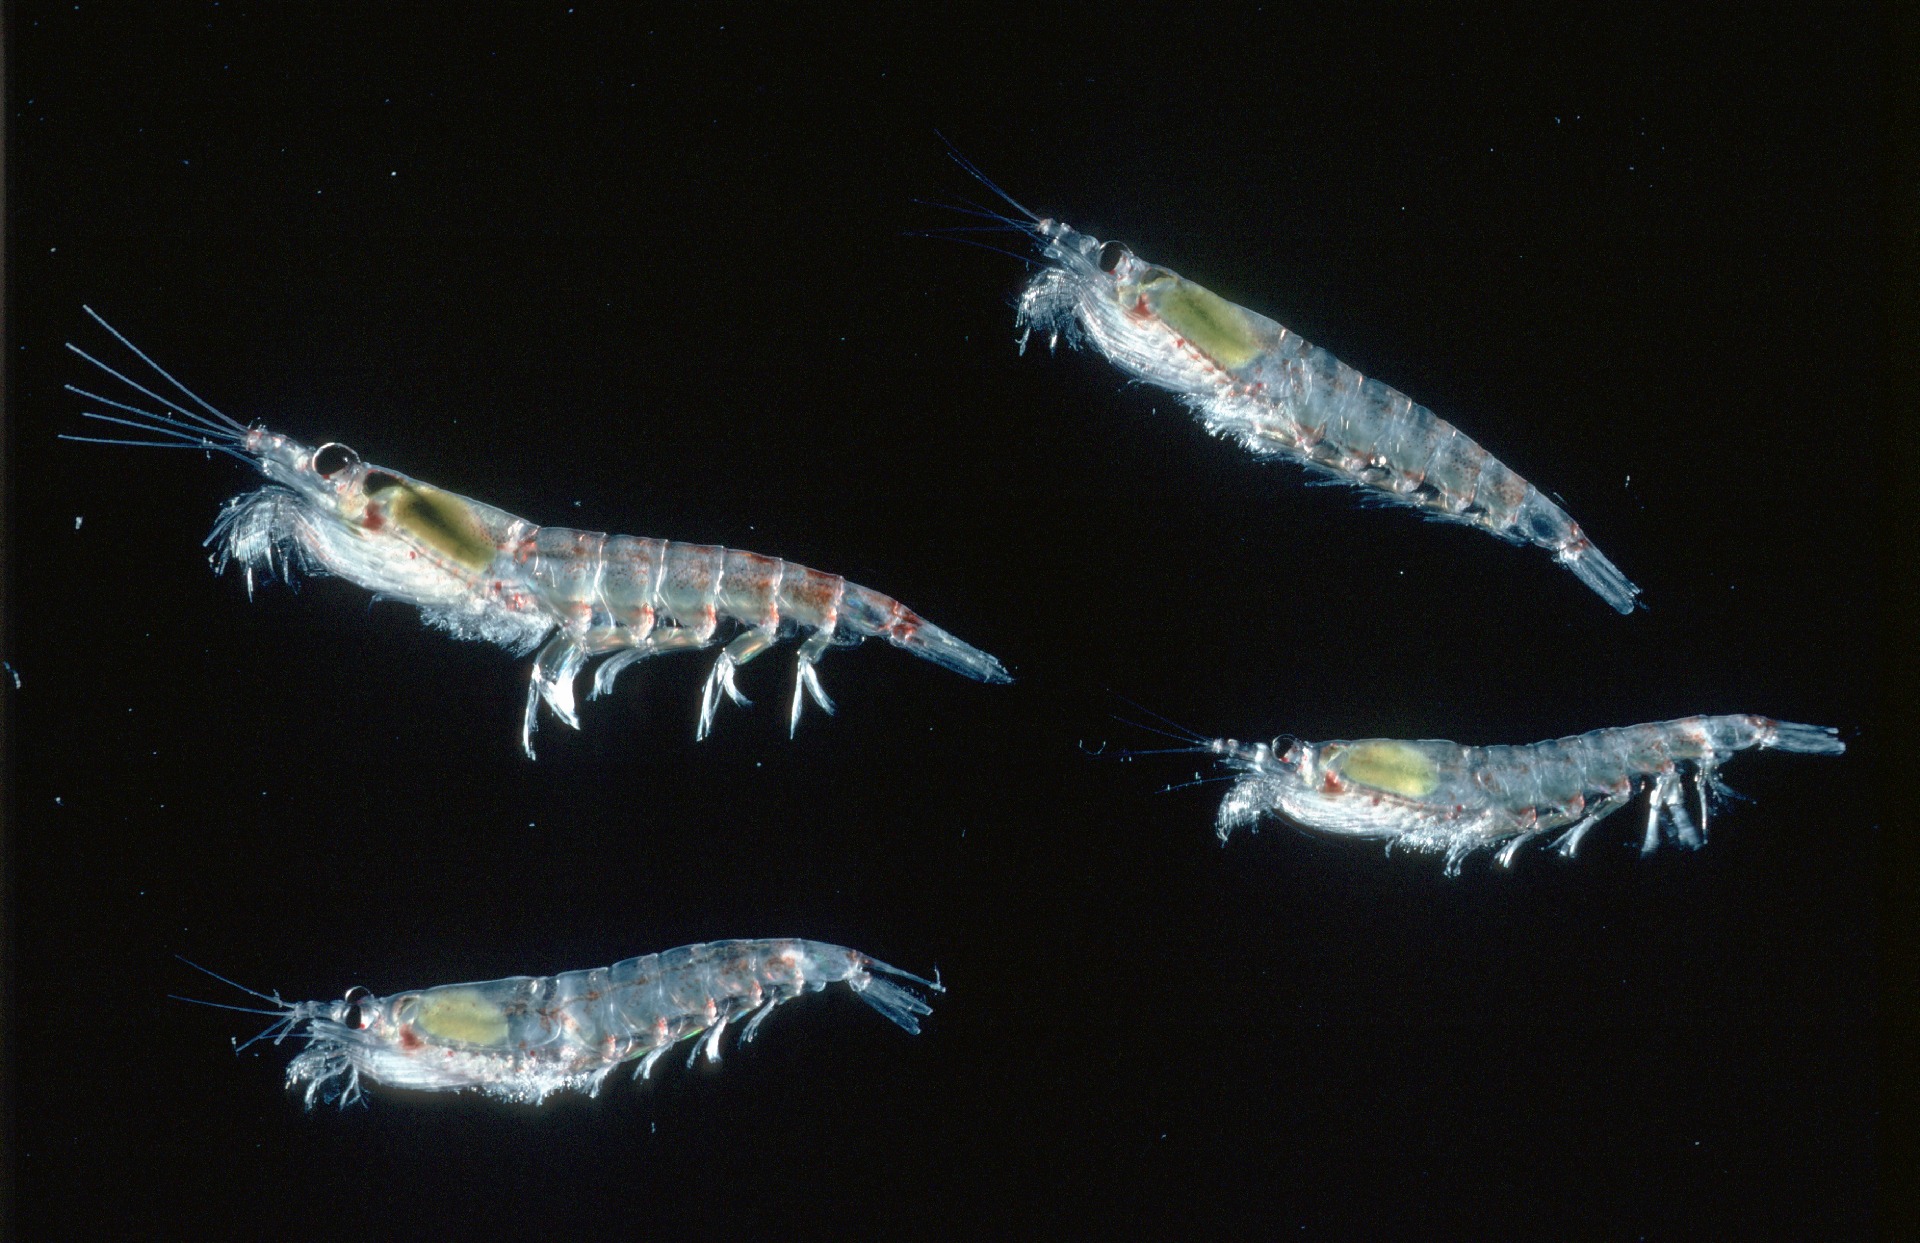
In addition to being a key prey item for many of the Southern Ocean’s higher marine predators, Antarctic krill (Euphausia superba) is the target of a commercial fishery. Effective management of the krill fishery requires an understanding of the controls on the distribution and abundance of krill. Particularly important are the pathways and timescales of movement and retention affecting krill distribution at scales relevant to both the fishery, and to predators such as penguins and seals.
The MMAK project is using state-of-the-art ocean-sea ice models to improve our understanding of the regional and local-scale processes that influence the distribution of krill in Commission for the Conservation of Antarctic Marine Living Resources (CCAMLR) Area 48. This area includes the southwest sector of the Atlantic Ocean, which holds approximately 70% of the total krill stock (Atkinson et al., 2008). We focus on the South Orkney Islands region, an area that is crucial for determining the overall availability of krill across the wider Scotia Sea region.
In collaboration with the Institute of Marine Research, Norway, we are using output from high-resolution ocean models and a fine-scale South Orkney region model (Figure 1) to drive individual-based models that will allow us to investigate movement of krill in the region and provide information for future calculations of krill flux. This will allow the underlying processes affecting transport and retention to be determined at spatial and temporal scales relevant to the fishery and predators (10s of kilometres, hourly-seasonal-annual-long-term time scales). The results will inform the development of feedback management procedures for the commercial krill fishery and will provide the present-day context for considering the sensitivity of the regional ecosystem to climate change.
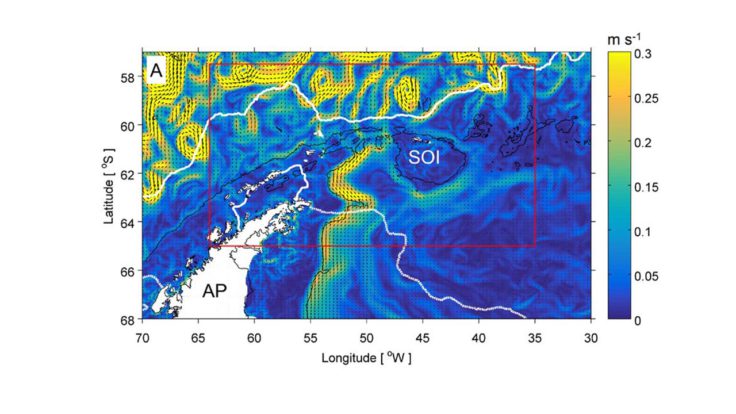
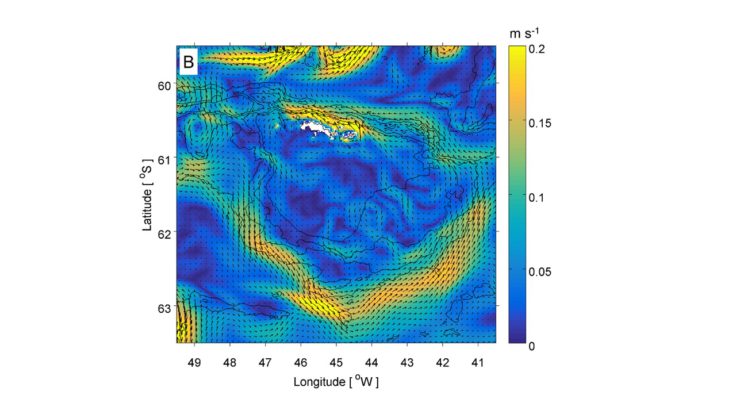
Figure 1: Example 5 day mean velocity fields at 10 m depth in the Antarctic Peninsula and South Orkney region. Shading shows current speed (m/s, capped at colour scale maxima), arrows show direction (every 4th grid cell plotted in A, every 3rd in B). A) NEMO 1/12° ocean-sea ice model. White lines show satellite-derived sea ice extent on 1st October 2015 (solid line) and 1st February 2016 (dashed line). 1500 m isobath plotted in black. Red line shows domain of fine-scale South Orkneys regional ocean model. AP—Antarctic Peninsula, SOI—South Orkney Islands. B) Subset of fine-scale South Orkney regional ocean-sea ice model. 500 m, 1000 m, 2000 m and 3000 m isobaths plotted (black lines).
-

-

Ecological Modeller
-

Ocean and Biophysical Modeller
External Collaborators
Angelika Renner – Institute of Marine Research, Norway
Olav Rune Godø – Institute of Marine Research, Norway
-
Krill provide a highway for ocean carbon storage
Read more of: Krill provide a highway for ocean carbon storageLarge krill swarms in the Southern Ocean could help remove additional carbon from the atmosphere, in a way that is currently ‘hidden’ in global models. Scientists knew that the carbon-rich […]
-
Scientists join policy makers to discuss conservation
Read more of: Scientists join policy makers to discuss conservationBAS marine researchers join nearly 300 international delegates at the annual meeting of the Convention on the Conservation or Antarctic Marine Living Resources (CCAMLR) beginning in Hobart today. For the […]