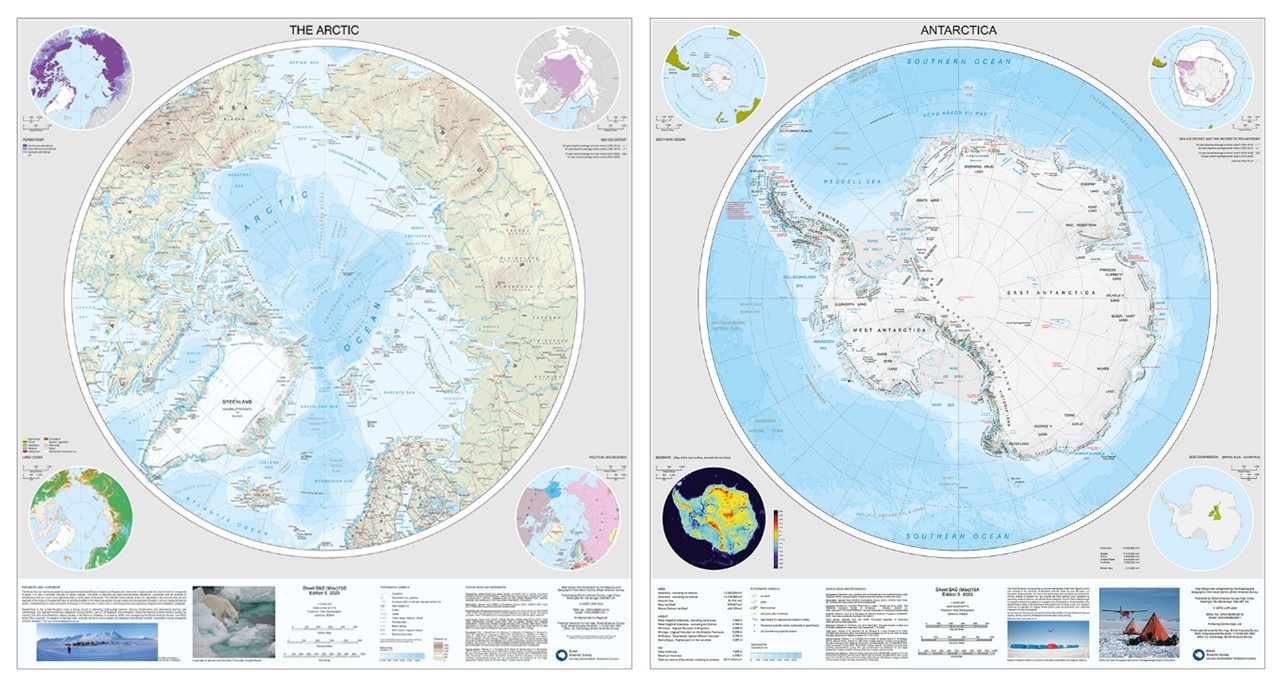
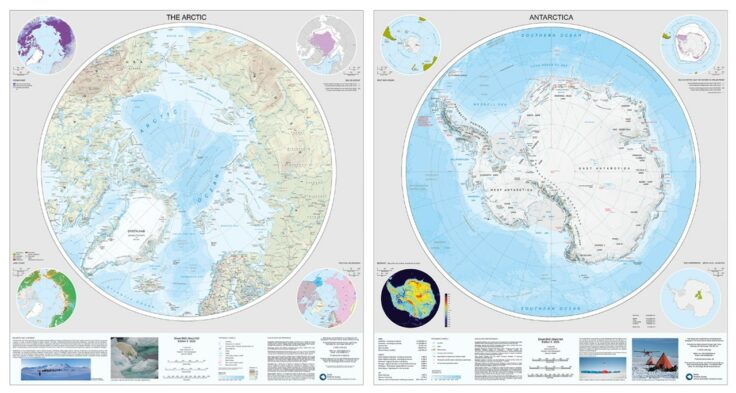
Dramatic changes in the Polar Regions are reflected in a new edition map of Antarctica and the Arctic produced by cartographers at the British Antarctic Survey (BAS). The flagship printed map requires updating regularly to keep track of these fast changing and fragile environments, with Antarctica on one side and the Arctic on the reverse. The new edition contains brand new sea ice extent data, updated towns and airports in the Arctic, and new ice shelf outlines in Antarctica after the recent calving of giant icebergs.
The Arctic map covers all land and ocean north of 60°N and this map in particular has been completely refreshed, with every piece of information having been updated or checked.
Many towns in the Canadian Arctic are now known by their indigenous names and these now feature on the map. These include Sanirajak and Naujaat. In all areas of the Arctic, man-made features such as roads, railways and airports are continuously changing due to improved links to the most remote areas.
Physical changes noticeable in the update include new ice fronts reflecting the retreat of many large glaciers flowing out from Greenland and Svalbard, and changes to lake extents as the landscapes around them adapt.
The maps are complimented by four inset maps showing relevant and current topics for the region. The Arctic maps show permafrost and land cover which are important and fast-changing aspects of the Arctic landscape, and both sides have maps showing sea ice extent.
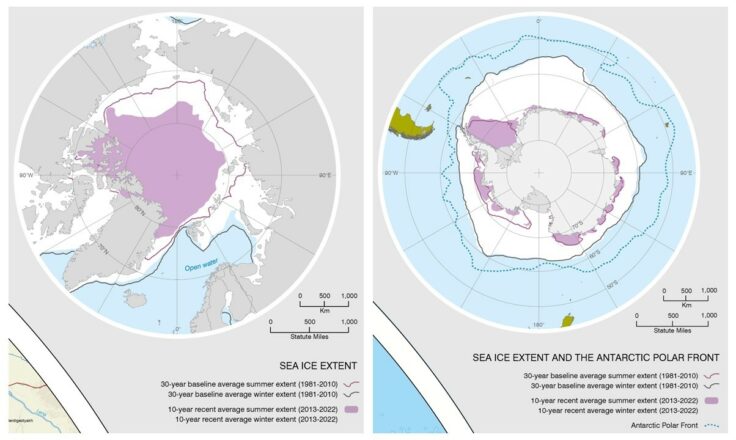
Sea ice maps for Antarctica and the Arctic showing the long-term 30-year average compared to recent 10-year averages.
They show the 30-year average sea ice extent although these extents are changing year-on-year, especially in the Arctic. So, a new recent 10-year average to compare against the 30-year average has been produced.
The difference in the Arctic summer extent is stark. Climate models that best capture the observed evolution of Arctic sea ice suggest the Arctic Ocean will be essentially sea ice free, in summer, before 2050. There is considerable uncertainty in the exact date because of naturally occurring variations in climate, with some models suggesting it is likely to occur, at least once, in the 2030s.
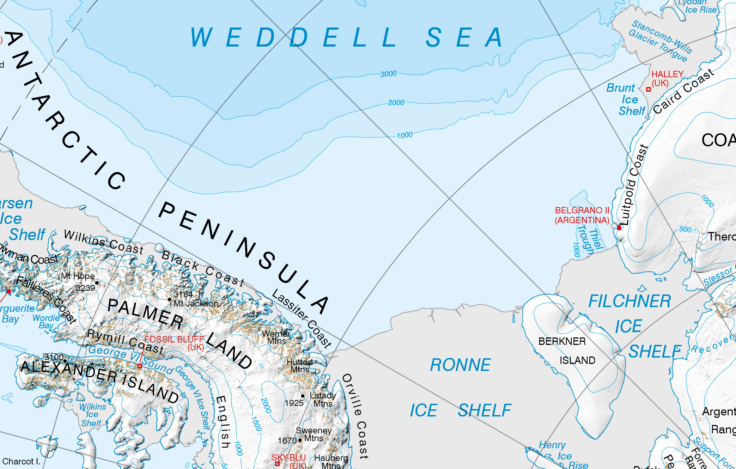
Other updates include new ice shelf extents in the Antarctic. For example, with the calving of giant iceberg A76 from the Ronne Ice Shelf in 2021 and the very recent calving of iceberg A81 in 2023 from the Brunt Ice Shelf where BAS’s Halley Research Station is located many ice shelf fronts are now located closer to the continent than they were in the previous versions of the maps The reduced extents of the ice shelves must be shown to accurately portray the new landscape.
Sea ice maps for Antarctica and the Arctic showing the long-term 30-year average compared to recent 10-year averages.
BAS cartographer Elena Field, who contributed to the map, says:
“The Polar Regions are changing quickly, both from the effects of climate change and improved infrastructure and transport routes, so we need to frequently update these maps to keep up. In addition, better data on the geography from satellite imagery, gives us a bird’s eye view of the continent, which has now been mapped better than ever before.”
Other improvements include updates to the contours and background hill shading on the land and also the bathymetry. The contours and hill shading are derived from the Polar Geospatial Center’s newly released REMAv2 dataset which covers Antarctica in a detail never before known for the whole continent. And the bathymetry is from a new version of the ‘General Bathymetric Chart of the Ocean’ which BAS scientists and data managers have been a part of by inputting data collected on various scientific ship cruises.
The map is available to purchase from various online retailers including UKAHT, Stanfords and NHBS both as a folded map with a sturdy card cover, and as a flat wall map. The RRP is £11.99 and is printed by specialist map printers Dennis Maps. Further information is on the BAS website here