Conducting world-leading research in the polar regions requires extensive logistic capability and know-how.
Polar capabilities
We operate the UK’s polar research infrastructure to supporting scientific discovery. For our own scientists, and for other British and international researchers
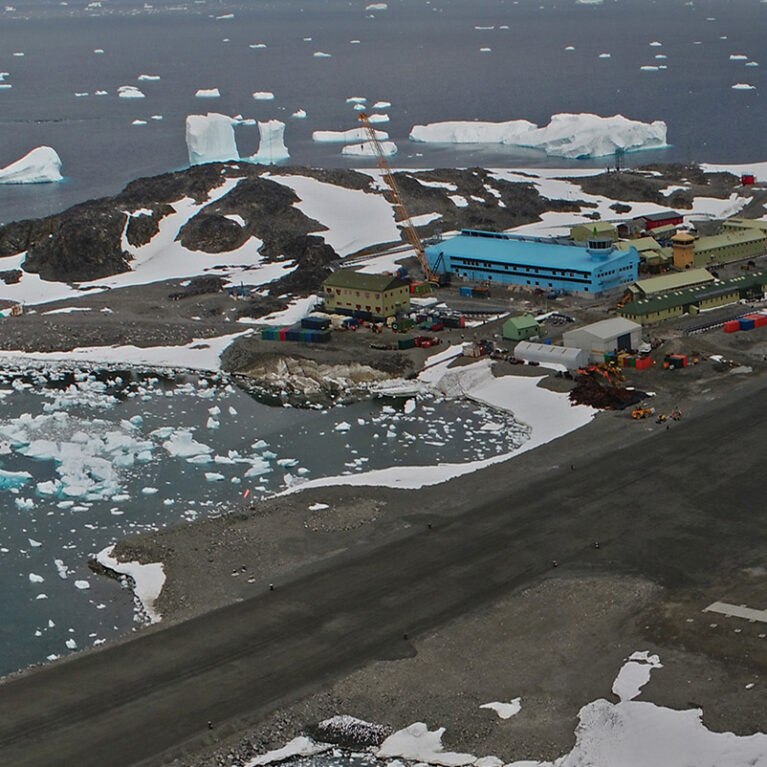
Research stations
Stations serve as crucial hubs for scientists, providing accommodation, laboratories, and the logistical support necessary for conducting long-term environmental monitoring and cutting-edge research.
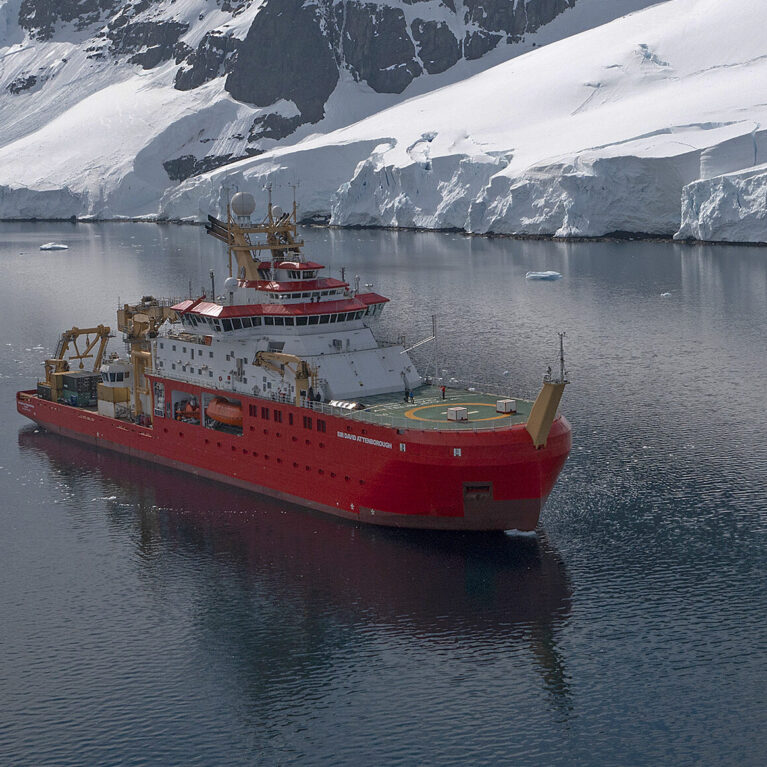
RRS Sir David Attenborough
Our state-of-the-art polar science ship provides scientists access to remote and challenging marine environments across the Antarctic and Arctic. It is equipped with a suite of scientific and operational facilities for understanding oceans and their role in Earth's ecosystem.
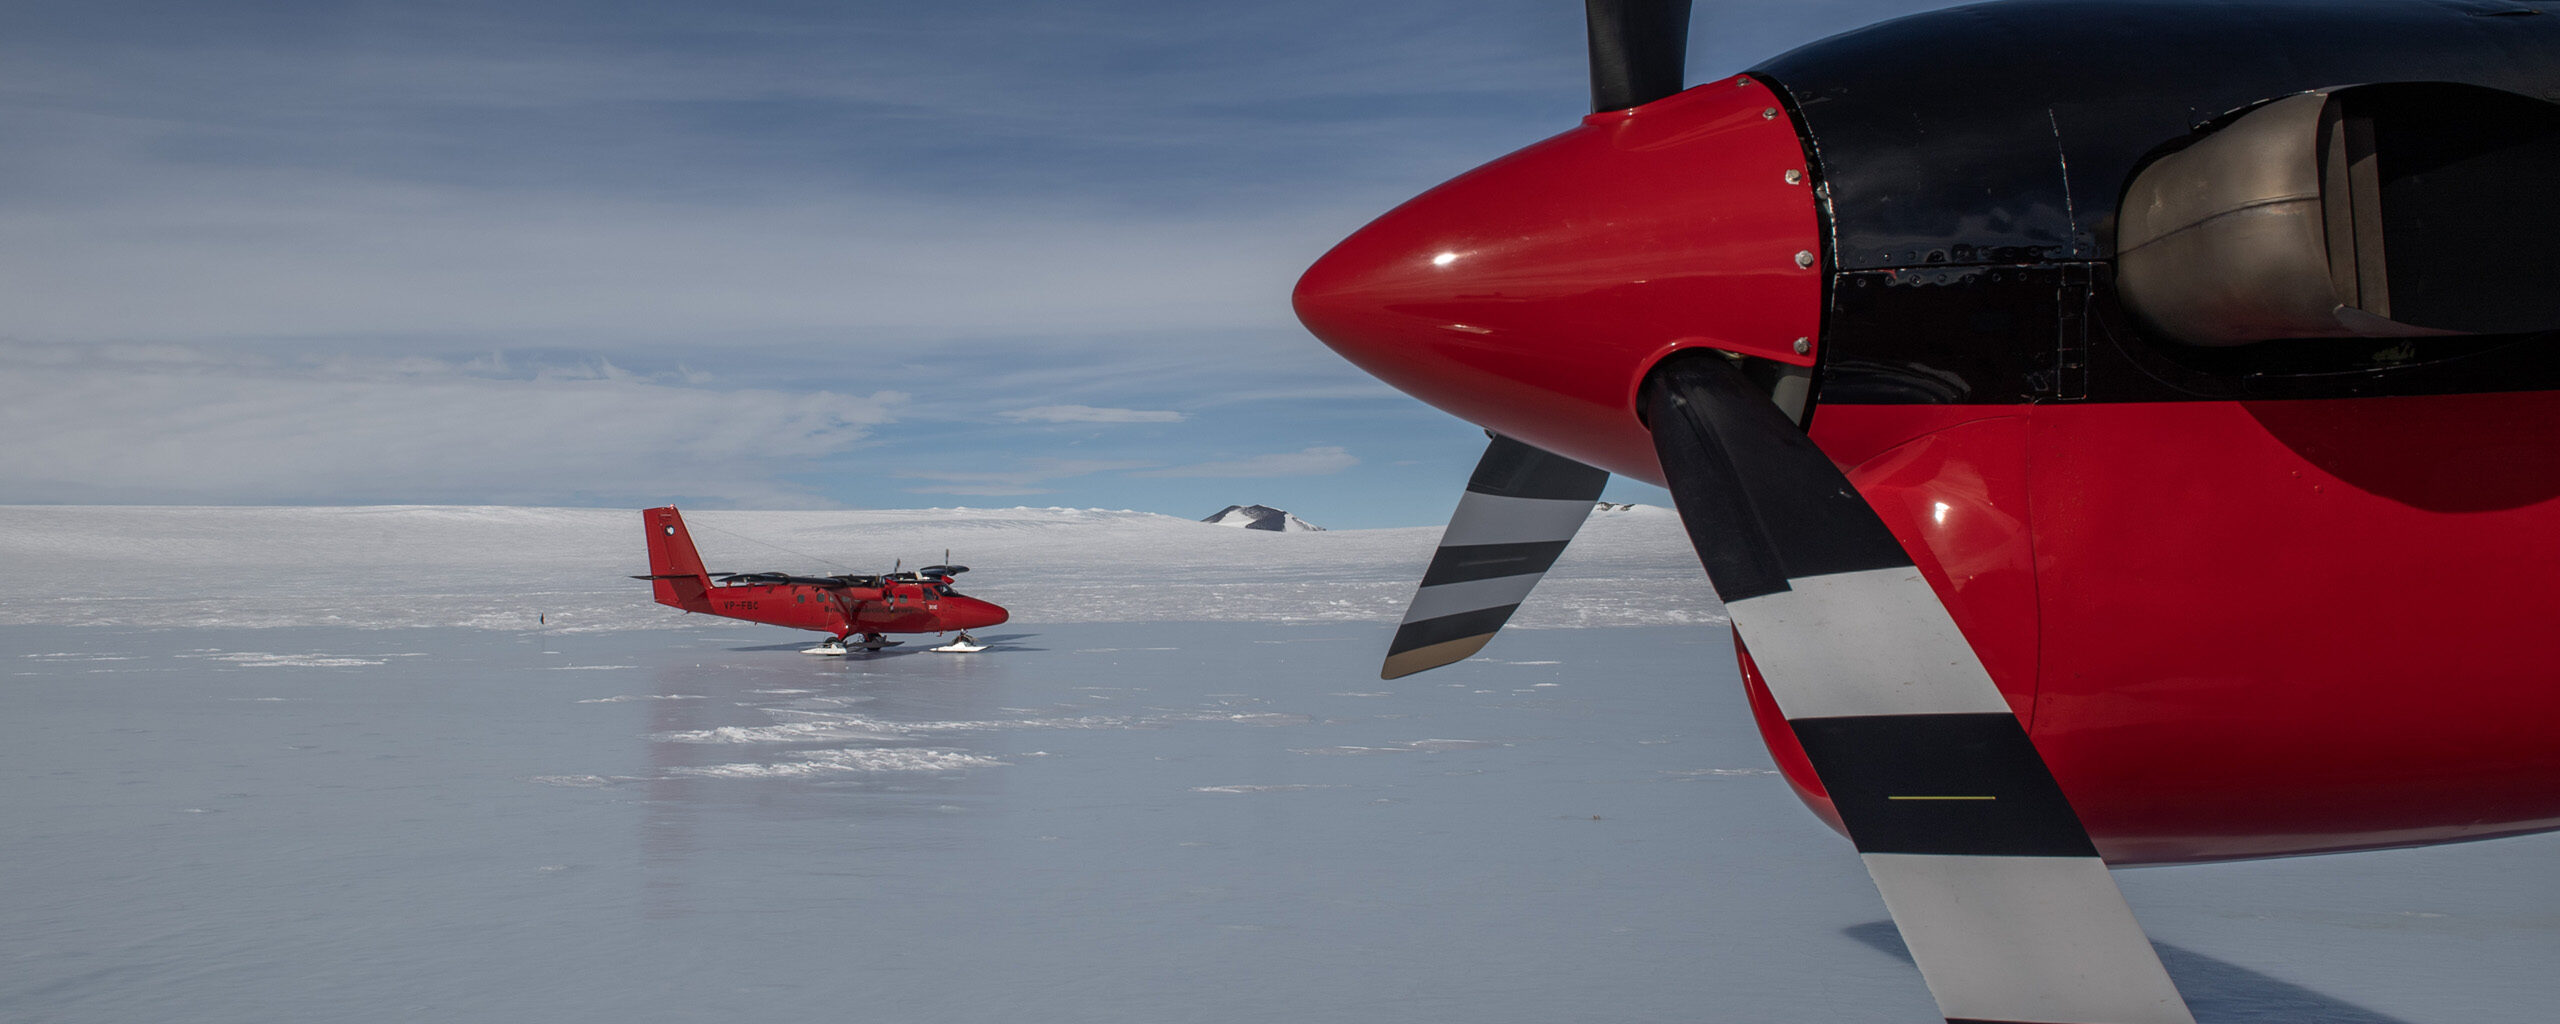
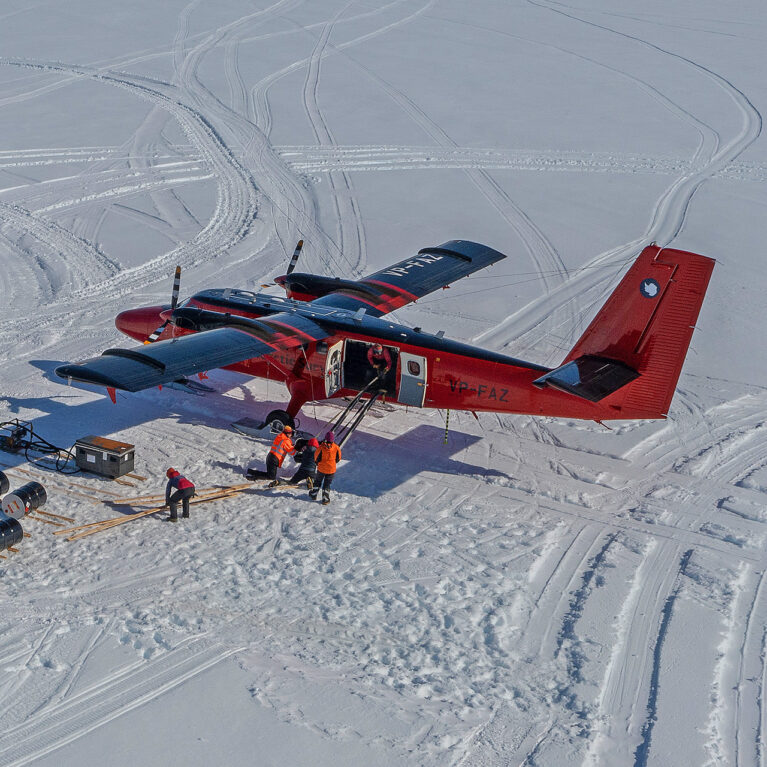
Aircraft
We maintain a fleet of 5 specialised aircraft to support its scientific research and logistical operations in the polar regions and beyond.
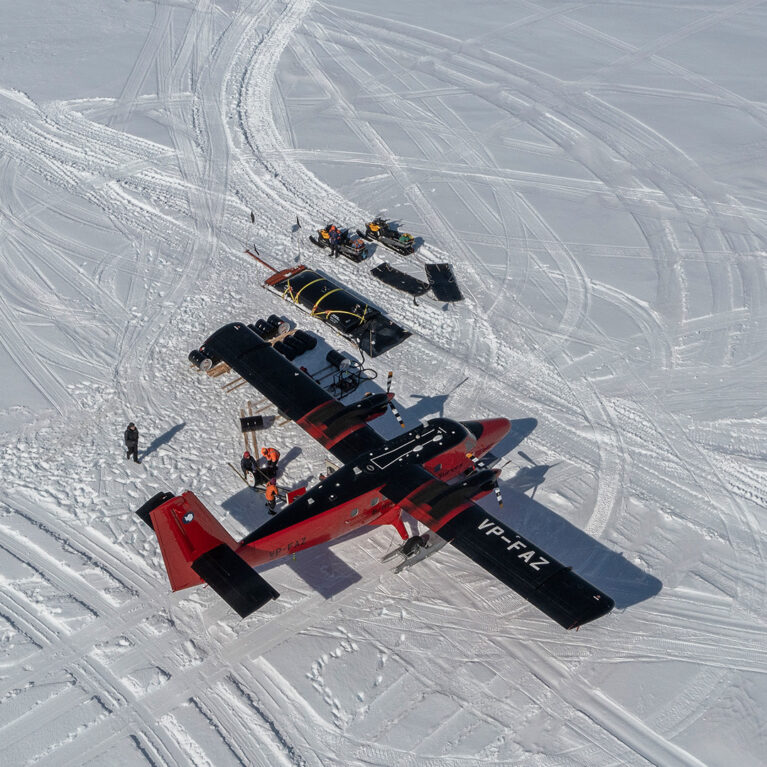
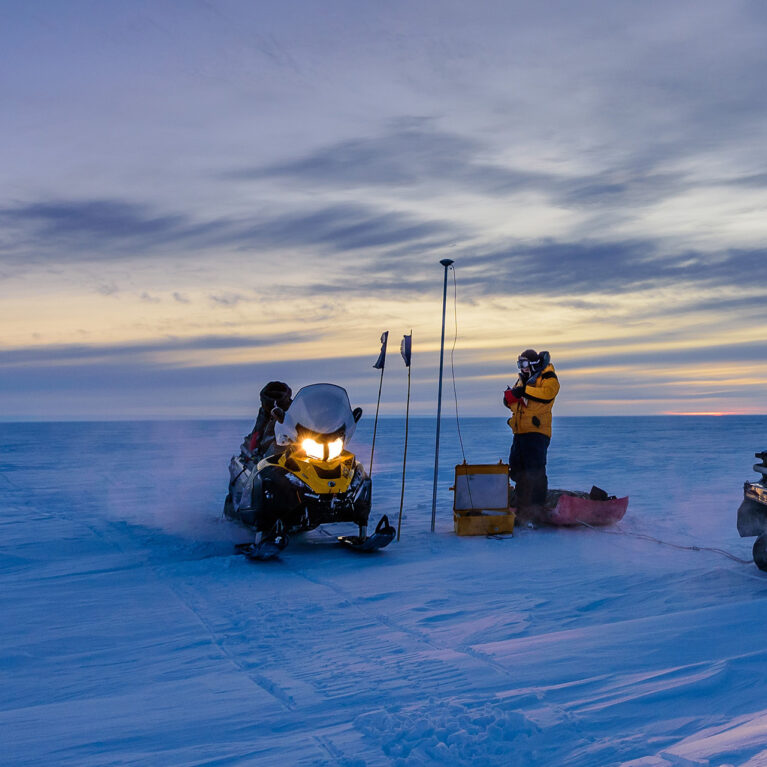
Working in the field
Whereas life on a British Antarctic Survey research station is relatively comfortable working in the deep field can be extremely challenging.
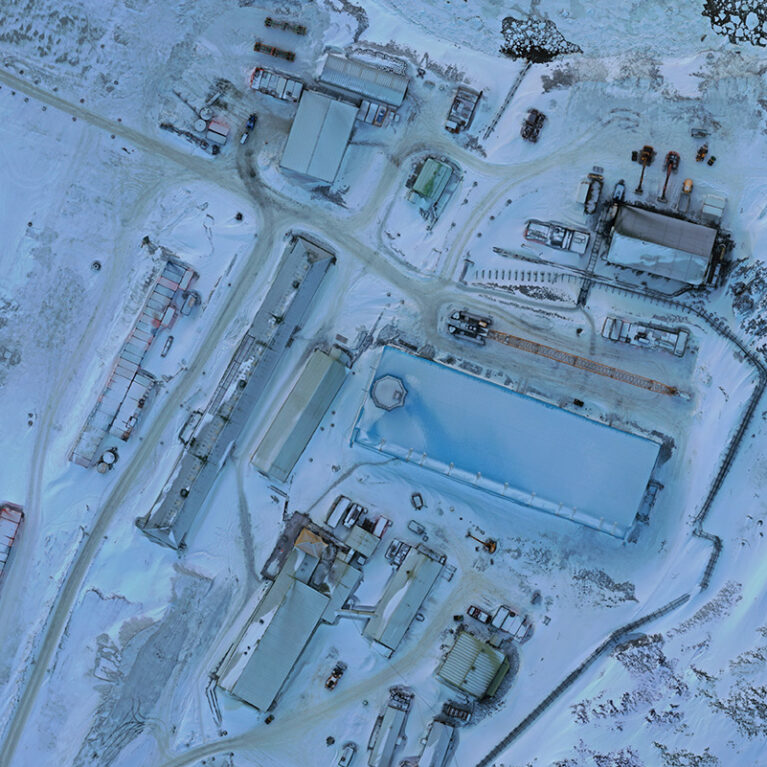
Mapping Antarctica and the Arctic
If you're working in the polar regions, you need reliable maps. From navigating sea ice to planning field camps to understanding ice sheet changes - geospatial data makes polar science possible.

Antarctic Infrastructure Modernisation Programme
We are in the midst of a long-term programme to enhance the UK’s polar research capabilities - the Antarctic Infrastructure Modernisation Programme.