Following the glider deployments our next destination was Rothera, the UK’s biggest Antarctic research station on Adelaide Island. Good progress was made until we hit the sea ice – 120 km of it.
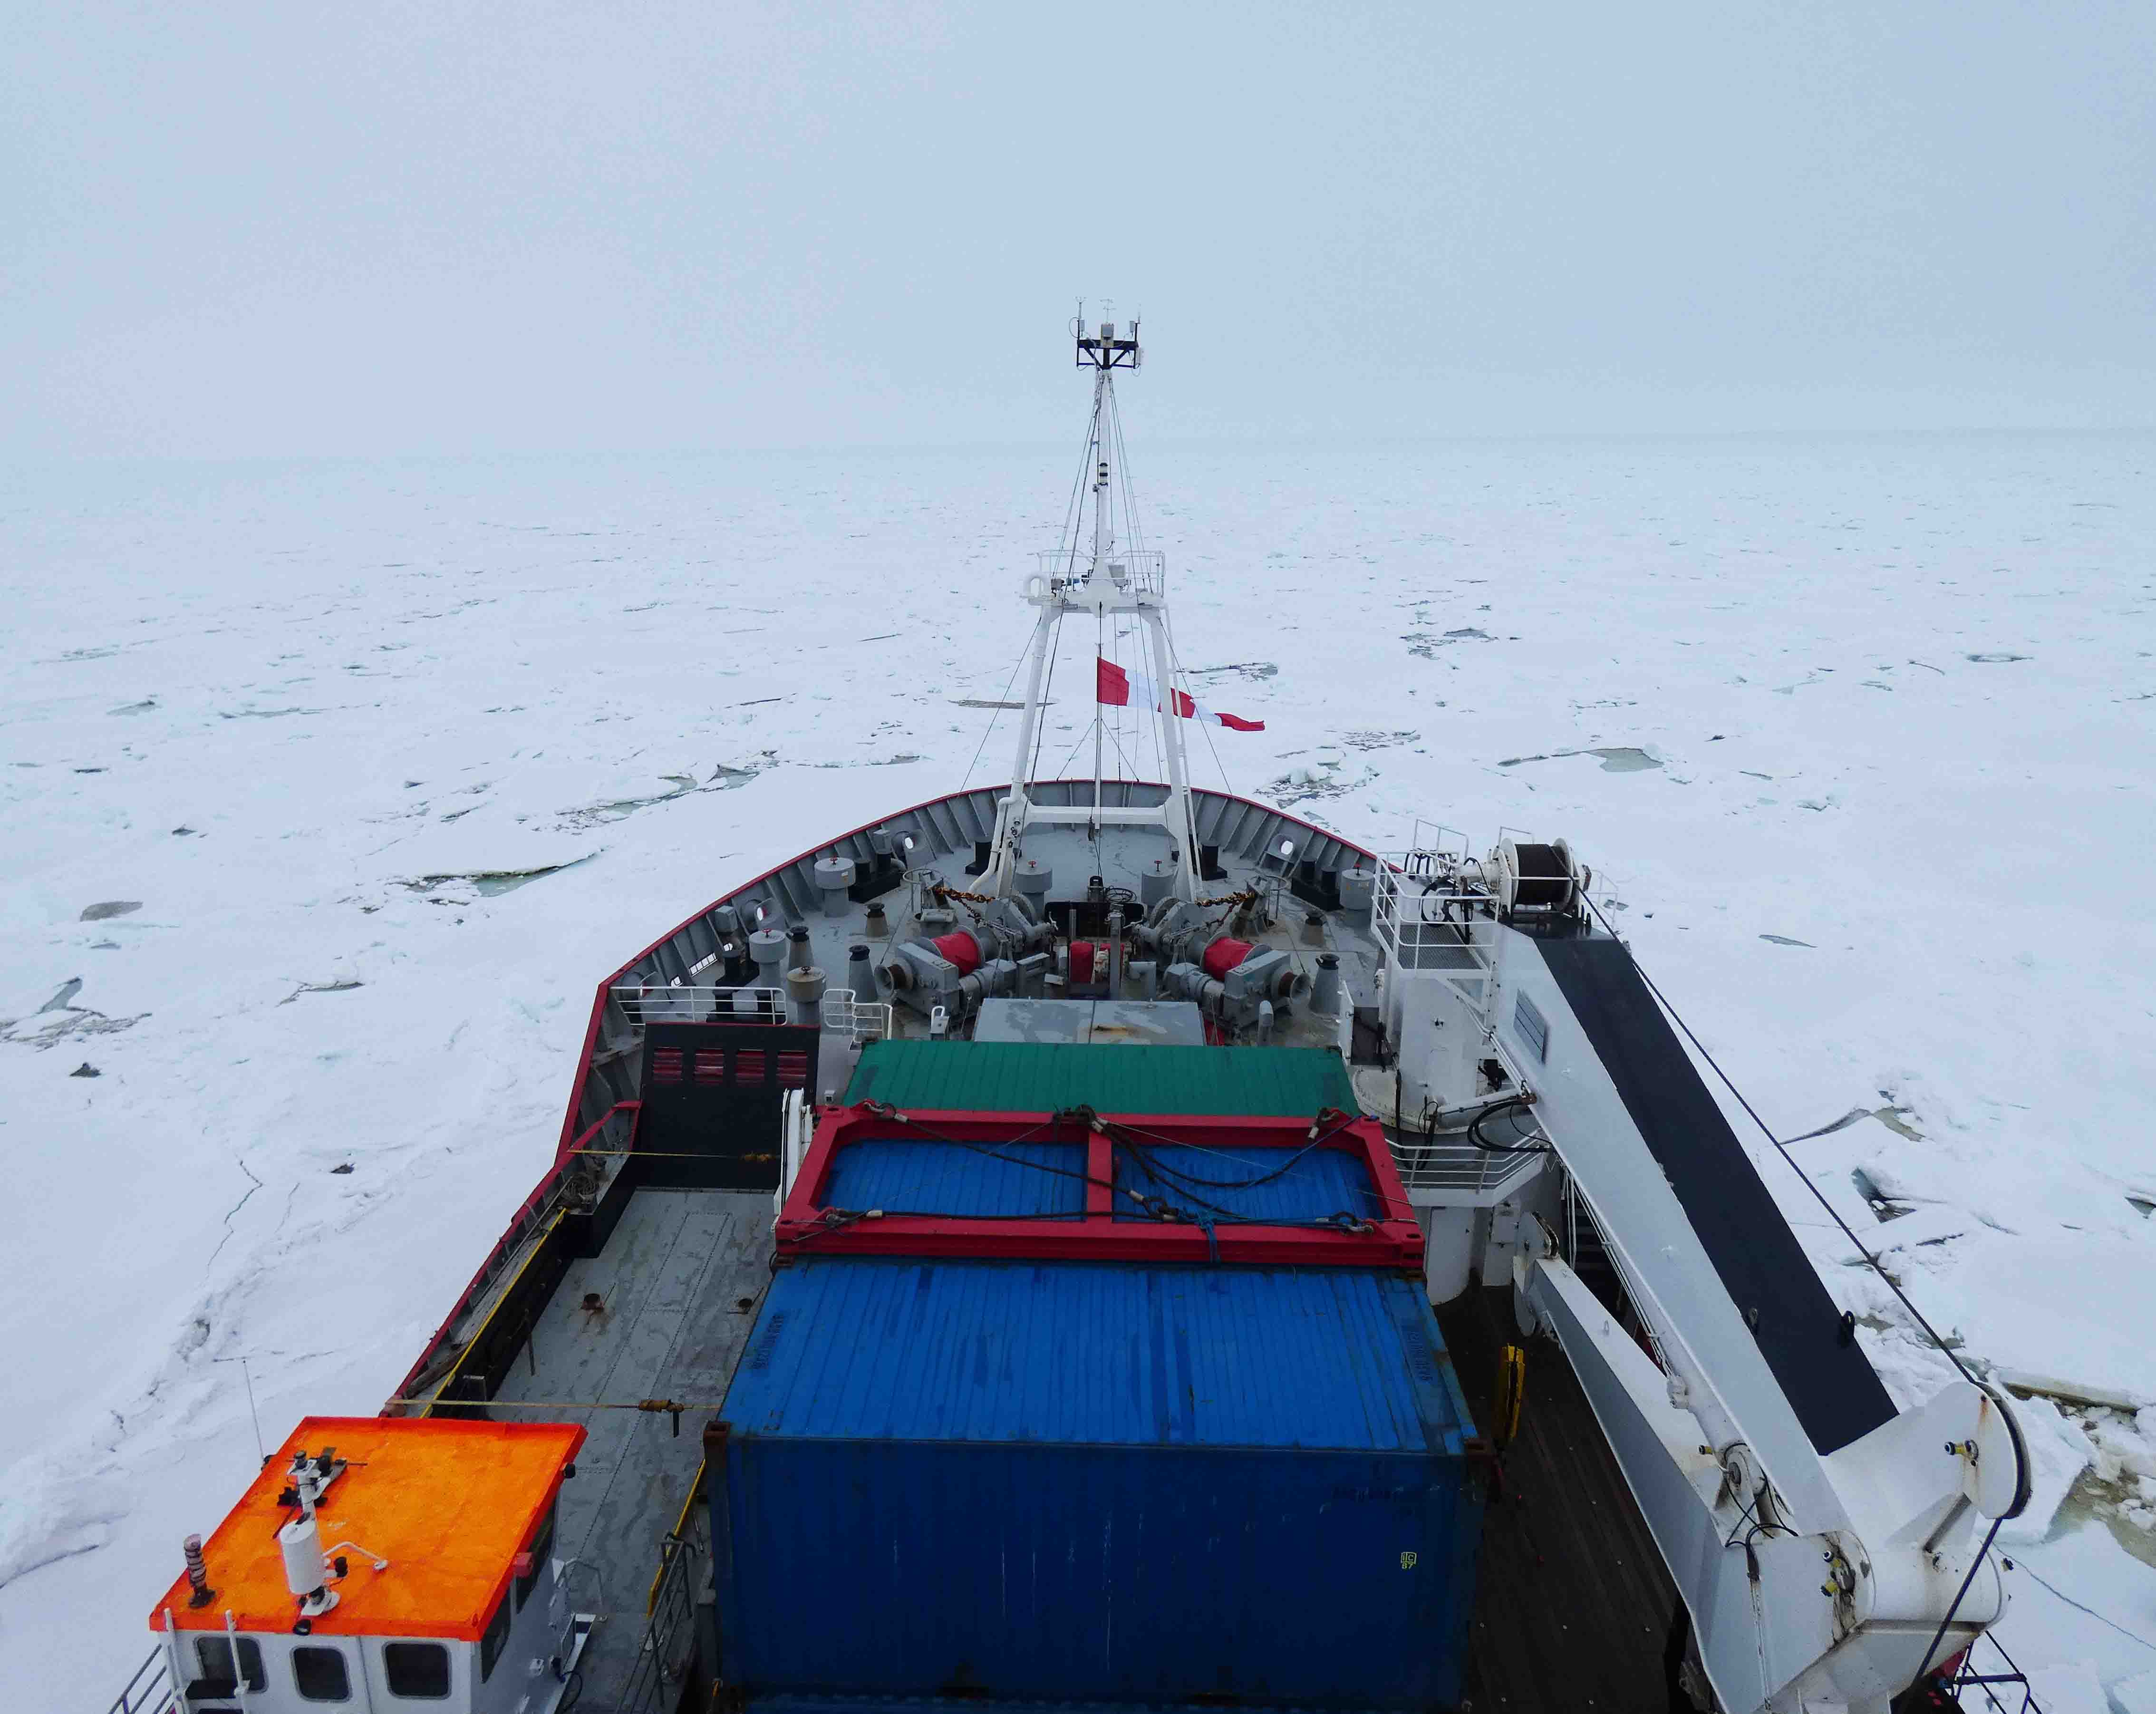
The RRS James Clark Ross encountered heavy sea ice on the way to Rothera Research Station, Adelaide Island. Photo credit: Ryan Scott.
Our first attempt through the ice brought us agonisingly close to Adelaide Island, we could see it in the distance but the ice was just too thick. Over the course of the following week, we made several other attempts to break through the ice, coming out to the ice edge and heading back in to try and find another route. We were supported by British Antarctic Survey aircraft which flew over several times looking for suitable routes through the sea ice. However, eventually we had to make the decision to turn back and head north to continue with the last part of the cruise.
The final science to be carried out on the cruise was to study the temperature, salinity and oxygen through the water column, from the sea surface to the seabed, at sites across the Drake Passage. This stretch of ocean is located between South America and the Western Antarctic Peninsula and is the roughest sea in the world!
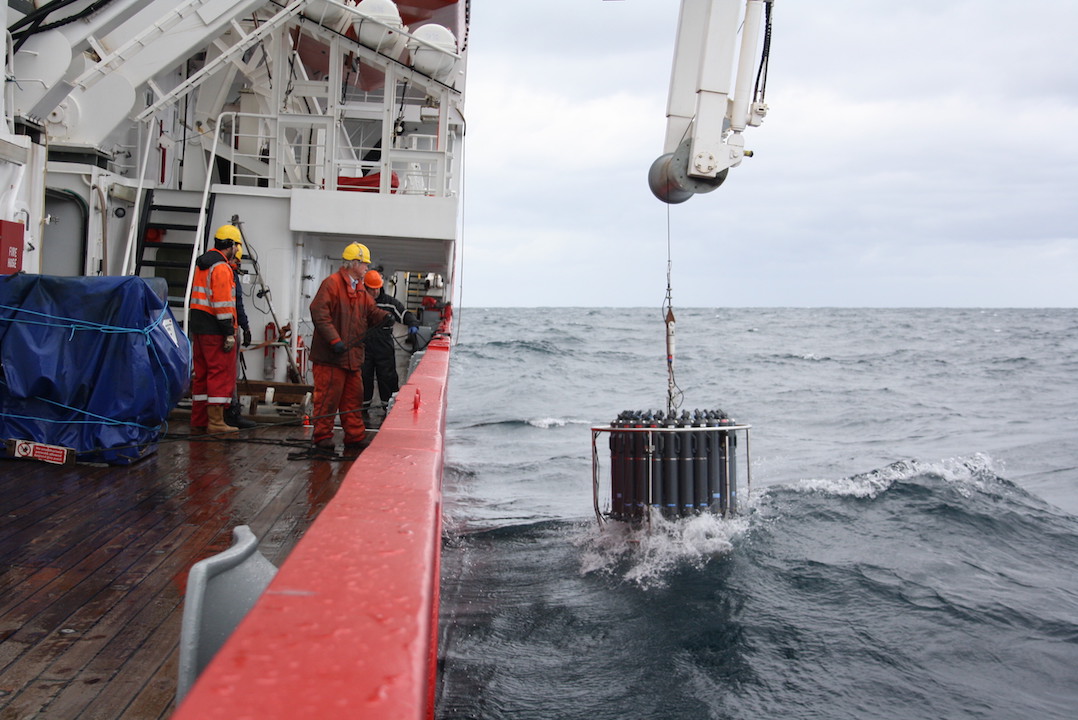
To collect these measurements the hydrography team worked 24 hours a day. At each site they cast the RRS James Clark Ross’s CTD rosette, which measures the Conductivity (which we can use to get salinity), Temperature and Depth (CTD) of the sea water, up to 4.75 km down to the seafloor.
The CTD rosette entering the water in Drake Passage. The tubes collect water at different depths. Photo credit: Oana Dragomir.
Measurements at these sites along the Drake Passage have been collected almost every Antarctic summer since 1993. Long term monitoring in this region allows us to understand how the flow of water, heat and other properties vary from year to year. This is important because the Southern Ocean plays a key role in global climate, storing heat and gases such as carbon dioxide. Understanding how heat is absorbed into the Southern Ocean and transported is a fundamental question for the ORCHESTRA project.
We also deployed four Argo floats with a new design meaning that are capable of taking CTD measurements, among other things, down to depths of 6000m – three times deeper than previous floats. These will provide data for up to 5 years, contributing to the ORCHESTRA project. It is customary to decorate these before deployment, so that is what we did.
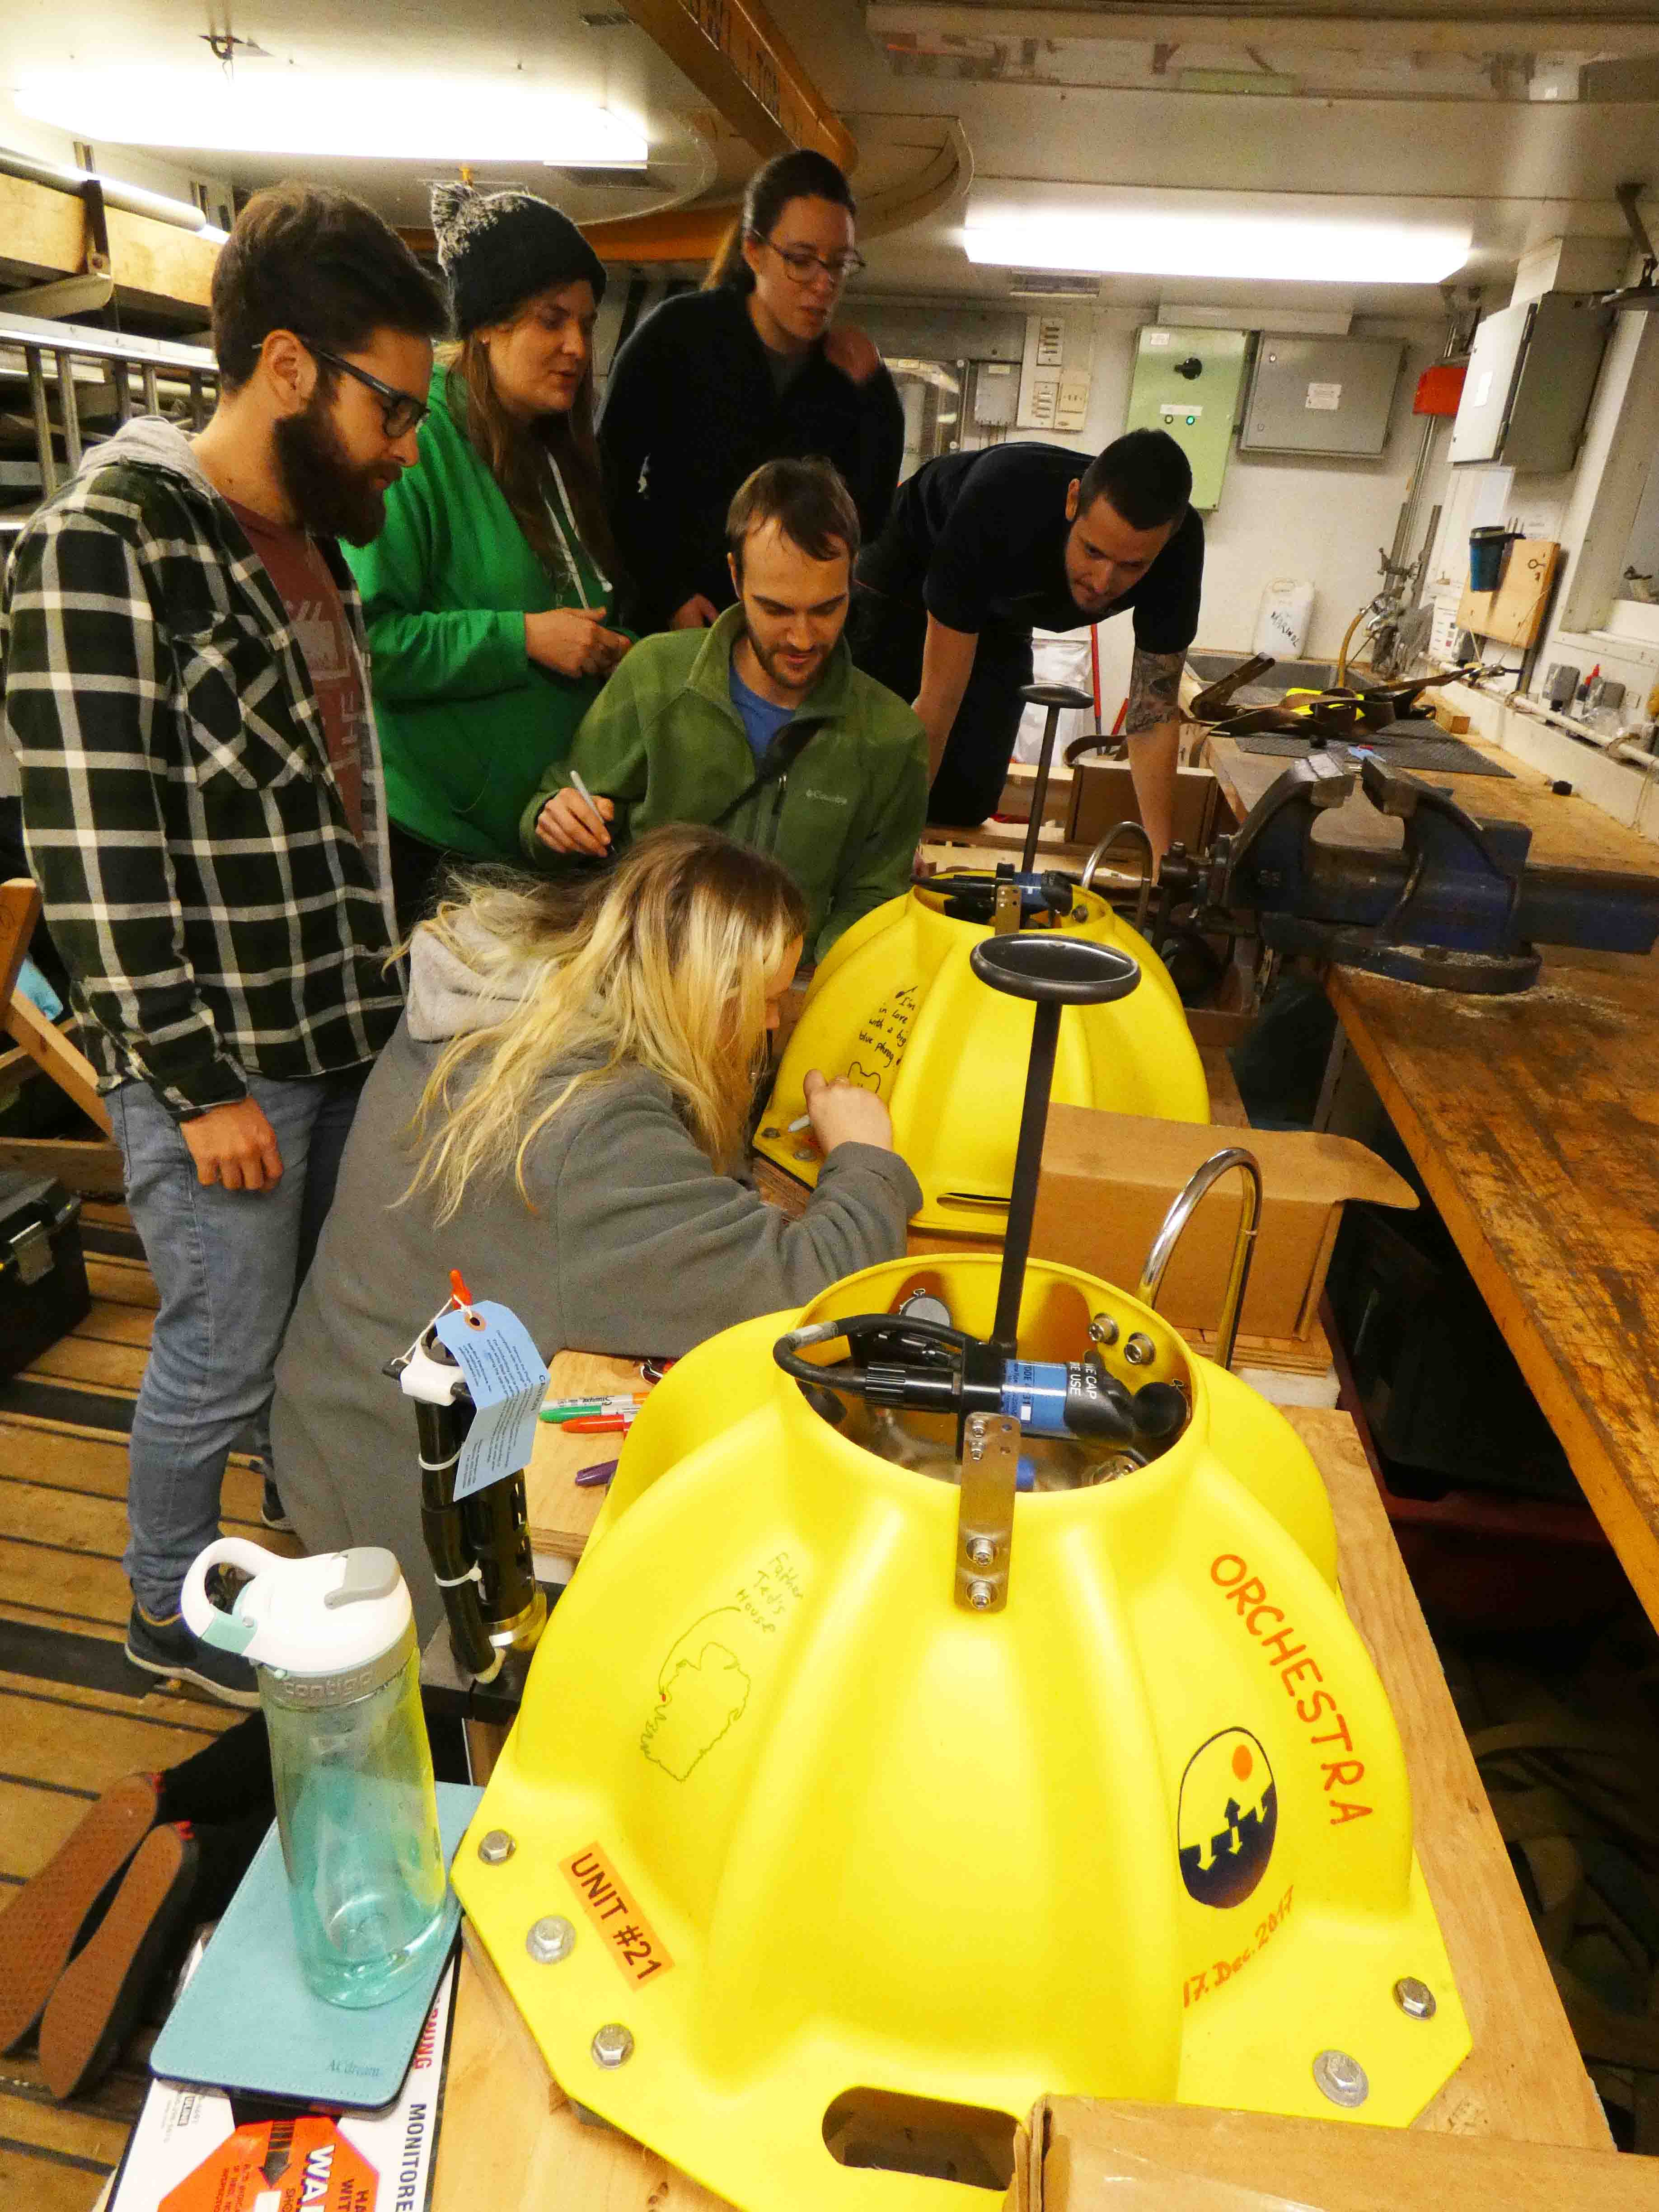
A few of the hydrology team decorating the Argo floats. Photo credit: Marlon Clark.
Continuing on the decorating theme, to demonstrate the pressure the CTD and Argo floats are under at depth, we attached a sock filled with a decorated polystyrene cup to the CTD. You can see the cup has retained its shape, but was squashed under the pressure – a unique memento and a cool way to end a great trip.
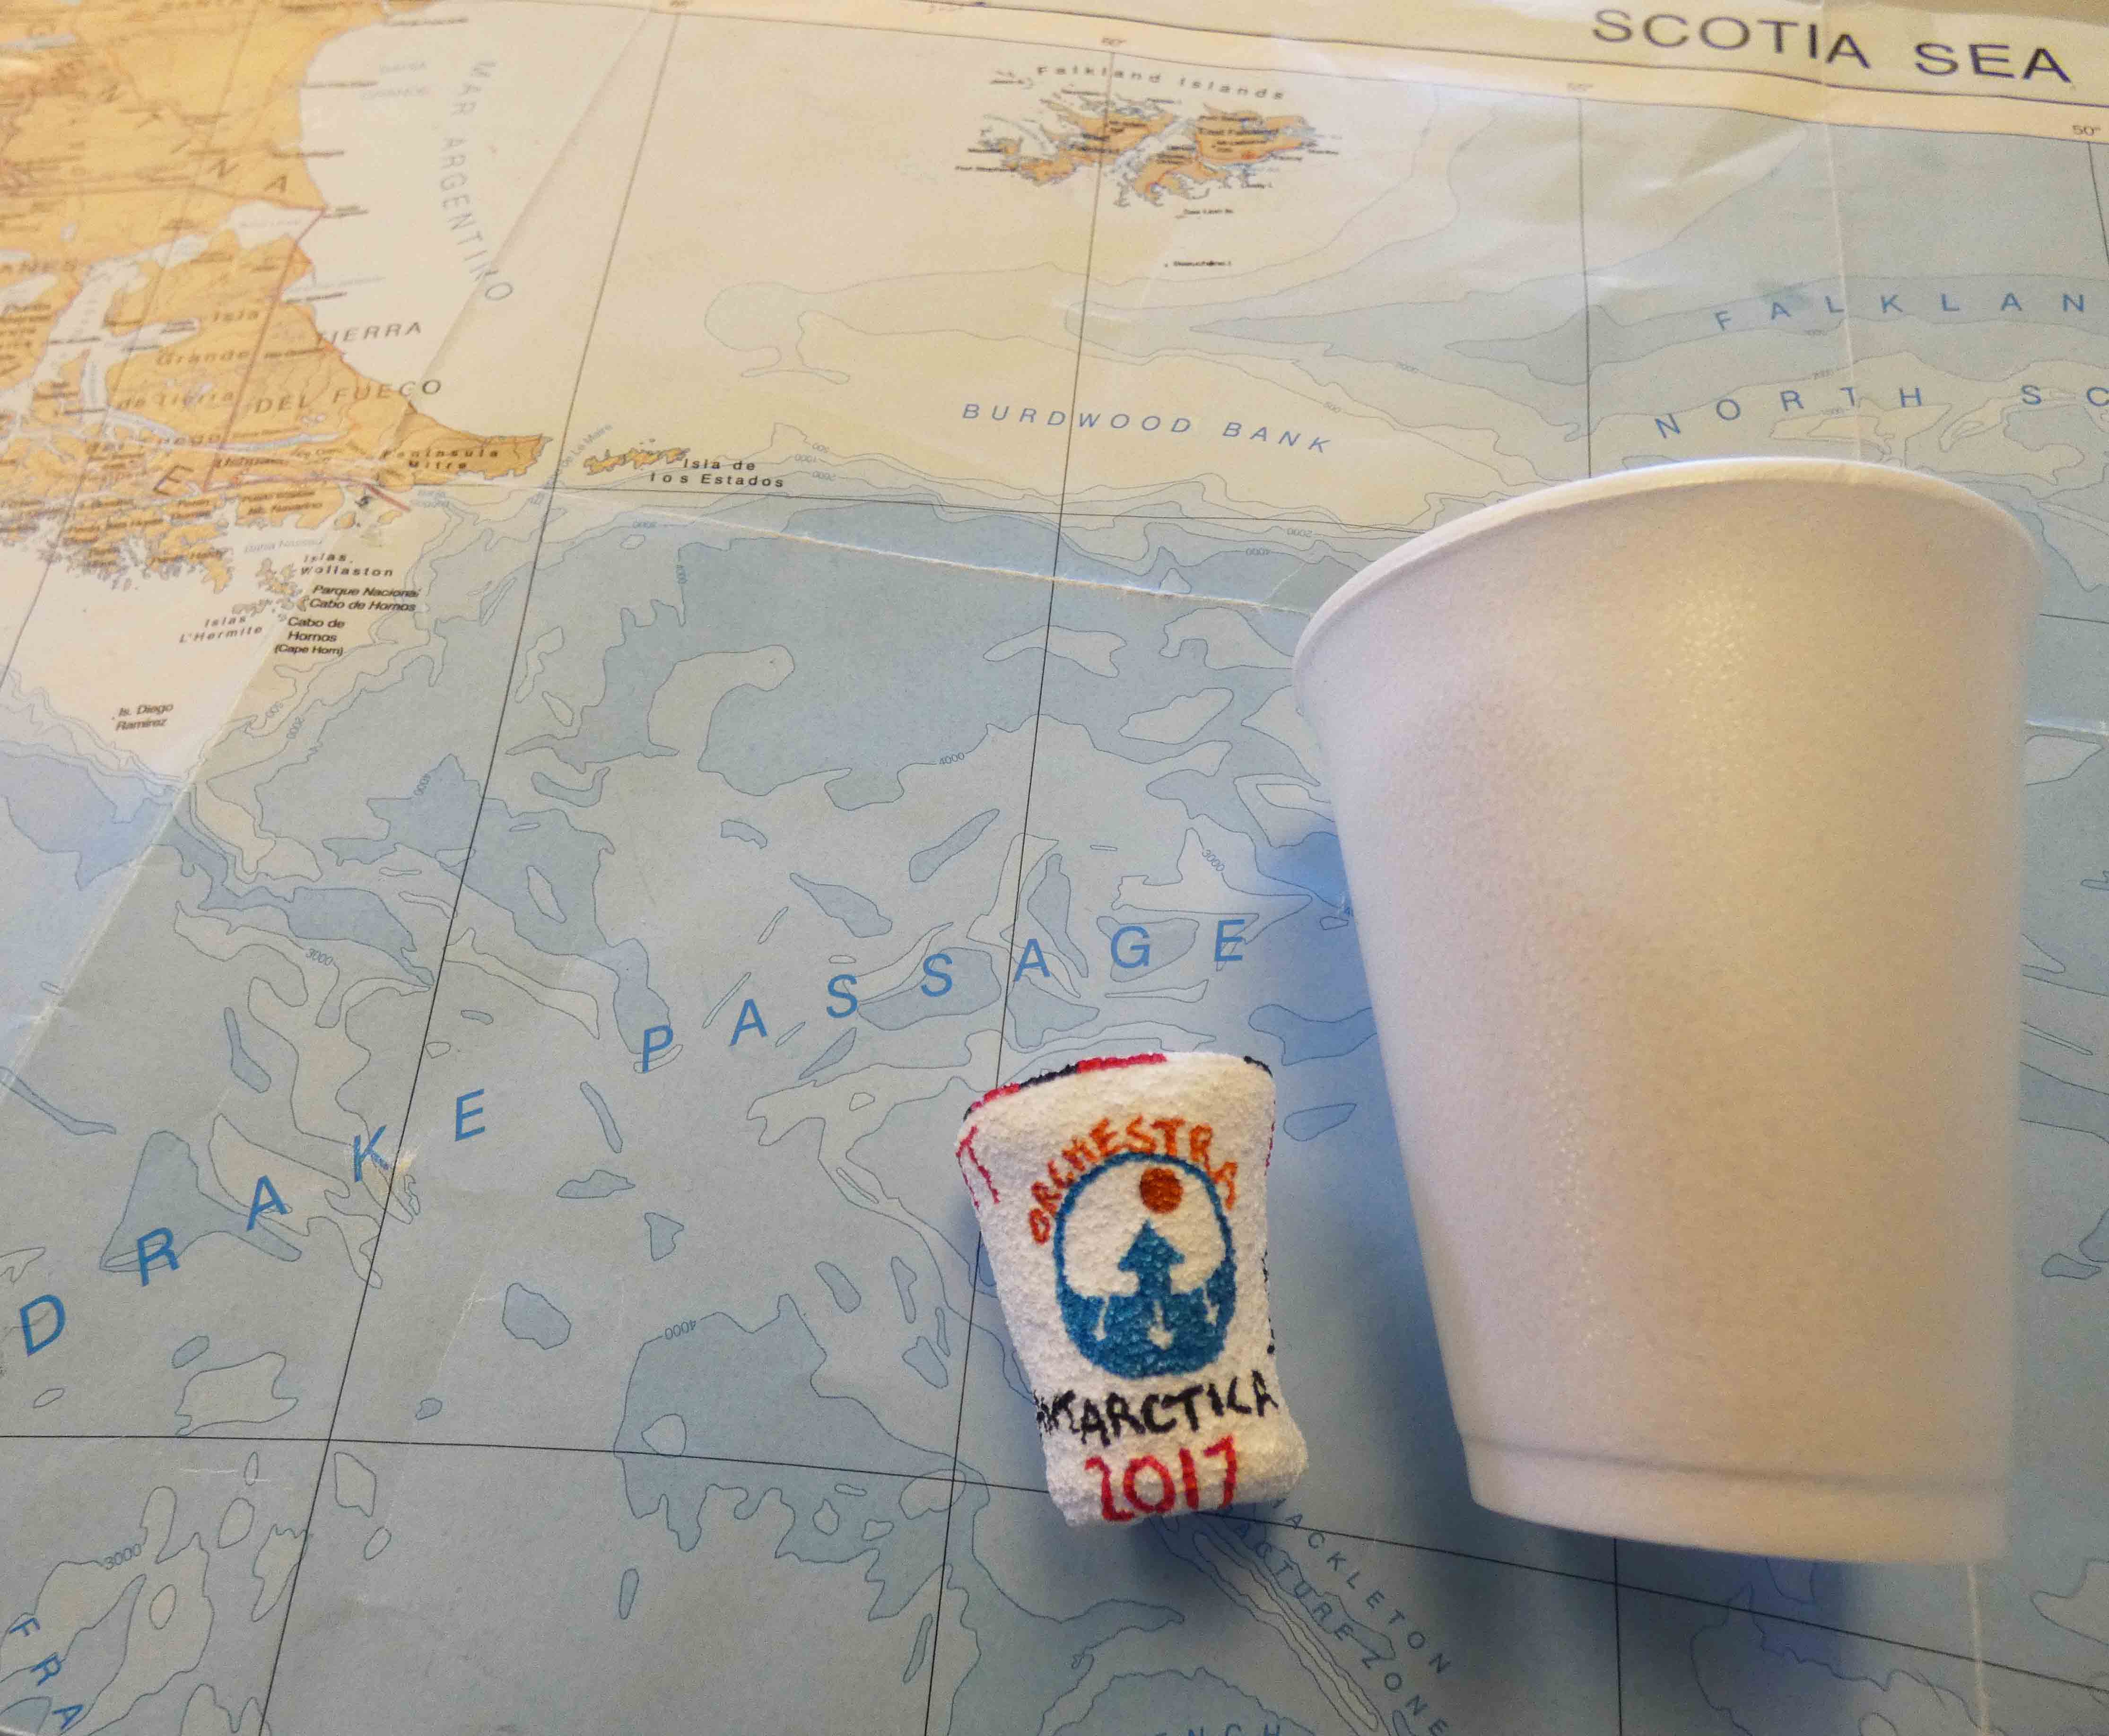
The effect of being under 3.9 km of seawater. Left: My decorated cup – miniaturised . Right: the cup’s original size. Photo credit: Ryan Scott.
To read more blog posts from scientists on the cruise, check out the Drake Passage Blog.