
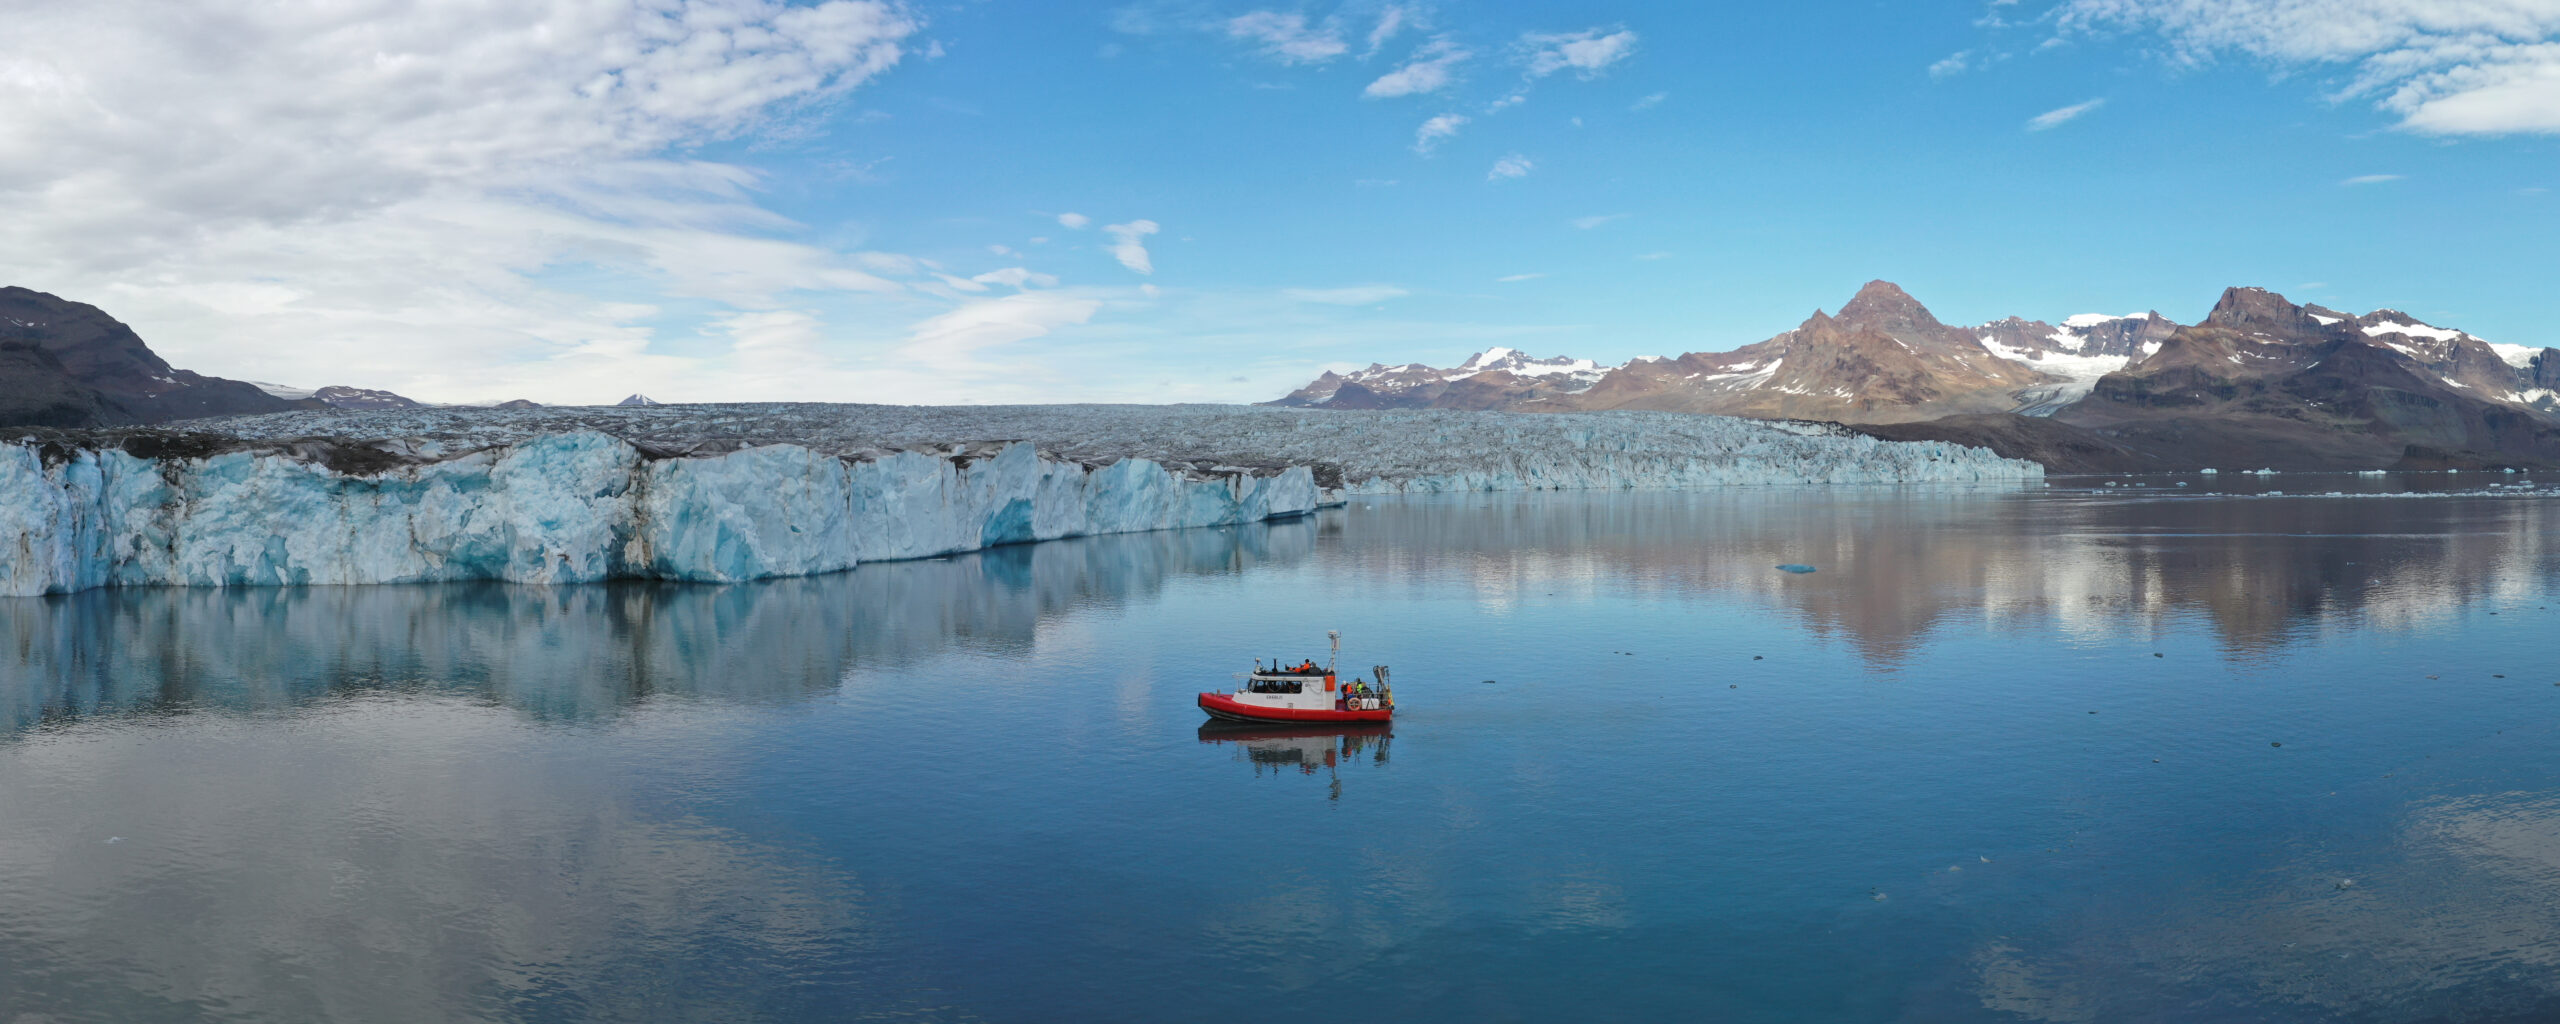
The vast ocean circulation system that keeps Britain’s climate mild has been predicted to weaken as the planet warms — and scientists are racing to understand what that might mean for our future. From Greenland’s fjords to the seafloor of the Atlantic, a new wave of research is gathering the data needed to find out whether this scenario will come to pass, and how quickly it might unfold.
Wander into the reception at the British Antarctic Survey’s Cambridge headquarters and you’ll find a poster map of Planet Earth. But it’s different from the one you’re probably used to.
We’re all familiar with the so-called Mercator Projection that puts the globe on a flat surface with the continents surrounded by oceans. The map in our reception, on the other hand, turns things around. It depicts the oceans bounded by all the continents, bar one – Antarctica, obviously! – which sits at the very centre of all the action.
“I love this map,” says BAS polar oceanographer Professor Mike Meredith.
“It’s the most honest way to see things. Yes, I get Mercator’s emphasis on continents, because that’s where we all live; you can pick out borders, your hometown, and so on. But we live on an ocean planet, and this map shows that all the oceans are connected.”
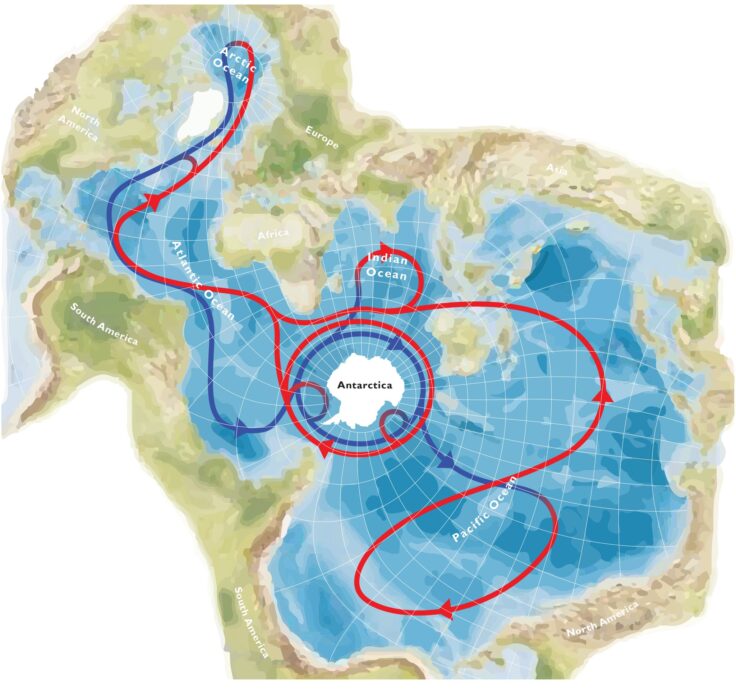
When Mike first saw the alternative projection in a magazine, his immediate response was to try to draw on it, to show how water moves around the globe – the great conveyor that transports heat, carbon and nutrients to all corners and back again.
This flow has many pathways, and Mike, with his Antarctic hat on, naturally thinks of the circulation around the White Continent as being the “central roundabout” in the system. But he taps the map in the North Atlantic: “This is the branch that’s getting all the attention right now.”
He’s referring to the Atlantic Meridional Overturning Circulation, or AMOC. It’s considered one of Earth’s climate tipping points – classified by the Intergovernmental Panel on Climate Change as “low risk, high impact”. Some climate models predict the circulation might decline or even slow dramatically in the future under certain warming conditions.
It’s a scenario that needs to concern us all. The AMOC is the conduit that brings warm, salty surface water northward from the tropics, hauling with it 1.2 petawatts of heat energy – equivalent to more than a million large power stations.
As this water reaches the cold, stormy North Atlantic, it releases that energy into the atmosphere, hence becomes denser and plunges to the ocean floor before turning south again and crawling back towards the equator as a slow deep-sea river.
And we’re one of the big winners. It’s a major contributor to the mild climate of the UK and northern Europe. Consider the difference in mean daily minimum temperature in January for Cambridge and the Canadian city of Labrador. Same latitude, and yet the former “basks” at a tolerable 2°C while the latter shivers in -27°C.
Severe AMOC weakening or slowdown would be expected to trigger profound cooling across Northern Europe. But it would be regional, says Mike. The rest of the planet would continue heating up:
“And if one area cools and the rest of the world is still getting warm – the boundaries across that, the thermal gradients will get steeper and steeper and steeper, and this might bring extreme weather conditions. Those weather events could make anything we’ve seen so far just look like small beer.”
A critical component in the AMOC system is the role played by a cluster of seas — the Labrador Sea, the Irminger Sea, and the Nordic seas — close to Greenland. These are sites of vertical convection, where the cooling, denser water heads down into the deep.
Overseeing much of this region is a large counterclockwise current system called the Subpolar Gyre: the intake manifold that keeps the convection zones supplied with warm, salty water to work with.
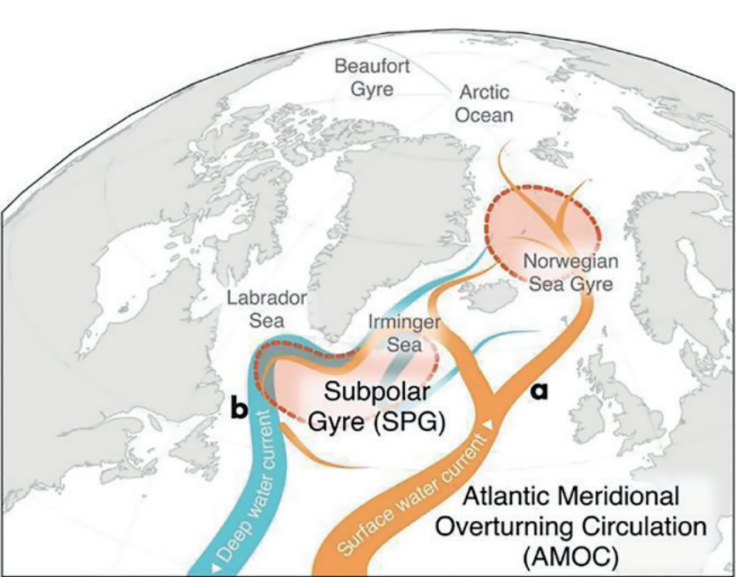
But for how much longer? It’s the future behaviour of this gyre that is the focus of a major BAS expedition due to set sail for Greenland this month.
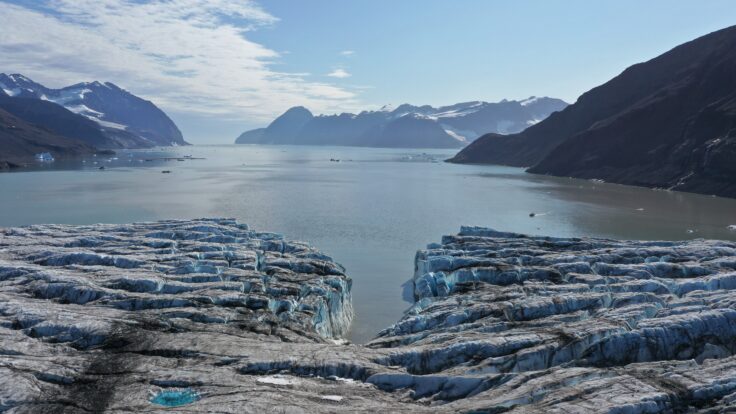
The GIANT programme – short for Greenland Ice sheet to AtlaNtic Tipping points from ice loss – is a £20m effort to try to understand precisely how Greenland’s 200 or so fjord glaciers melt, in particular when confronted by warm ocean water. So, why is that important for the gyre and overturning circulation?
We know the Greenland ice sheet is already losing a lot of mass, about 270 billion tonnes per year. It’s part melt-runoff in the summer warmth and part iceberg discharge. But, ultimately, it’s all fresh water — equivalent to emptying Loch Ness more than 35 times over, every single year — that’s spilling into the North Atlantic.
And because this “hose” is significantly lighter than the salt-heavy water coming up from the tropics, we could get into a situation where the gyre becomes capped at the surface, smothering the convection “pump”. This wouldn’t necessarily trip the AMOC as well, but it would be a significant change to the overturning system.
Already, large global climate models like the UK Earth System Model (UKESM) are suggesting a shutdown of convection in the gyre by the 2040s. But we don’t really know if that’s correct because we’re not properly characterising Greenland melt in the fjord glaciers that drain the ice sheet.
“A major uncertainty is how those glaciers respond to warm ocean water entering the fjords,” says BAS marine geophysicist Dr Kelly Hogan. “Right now, we don’t have good enough knowledge of the physics right up against the ice – where the ocean meets the front of the glacier. And we don’t have that physics in the models to show us how the melt gets into the North Atlantic.”
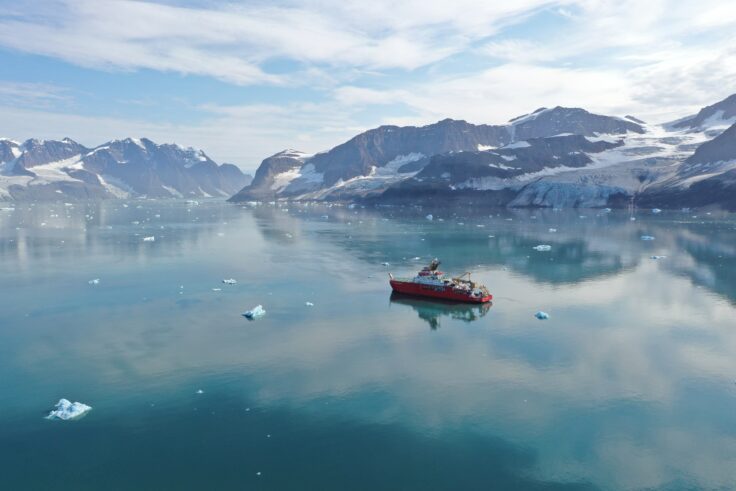
To fix this, GIANT will be taking the RRS Sir David Attenborough into a number of Greenland’s fjords over July and August 2026. Kelly and her team will be deploying an arsenal of aerial, surface and underwater drones to measure exactly what’s going on, right down to the millimetre-scale where turbulent plumes of meltwater move across the leading cliff face of a glacier.
The observations will be used to accurately represent these processes in a new generation of melt models.
That’s vital because, as BAS ice-ocean modeller Professor Paul Holland points out, we need better, bespoke tools for Greenland. Applying models that worked in, say, Antarctica, won’t cut it in the polar north:
“To give an obvious example, consider the Coriolis force. Antarctic ice shelves are so large, their meltwater currents can feel the rotation of the Earth, so when you make a buoyant flow, it doesn’t go up the slope, it goes across the slope. Whereas with the vertical face of a Greenland fjord glacier, its length scale is too small; the Coriolis effect is too small – the flow just goes straight up the ice face.”
The GIANT programme is funded by the UK’s Advanced Research and Invention Agency (ARIA). It’s backing a range of teams in academia and industry to investigate the relationship between the Greenland ice sheet and the Subpolar Gyre, and their potential futures.
The big out-there goal is to see if it’s possible to develop early warning systems. Can you identify “precursors” — distinctive patterns in ice or ocean properties or perhaps the weather that recur in the years leading up to a shift in behaviour? Can you spot a tipping point before it happens?
Dr Bablu Sinha is working on PROMOTE, a sister modelling project to GIANT at the National Oceanography Centre. He says the ARIA-supported investigations will probe the credibility of the UKESM’s already alarming projections:
“We see many climate projections now forecasting that the deep convection in the North Atlantic’s Subpolar Gyre will weaken sharply, or even cease entirely, by around mid‑century. Our job is to put that kind of result under intense scrutiny – stress‑testing the models with new physics and observations to see whether such a collapse is a real risk, and if so, how and when it might unfold.”
Today, scientists can measure directly how currents are behaving with arrays of instruments strung across the Atlantic at key locations.
The 50 or so moorings of the OSNAP (Overturning in the Subpolar North Atlantic Program) monitor the Labrador and Irminger seas in a line that stretches from Canada to Scotland. Further south at 26.5 North latitude is the RAPID array – it’s got nine moorings stretching from Florida to Africa.
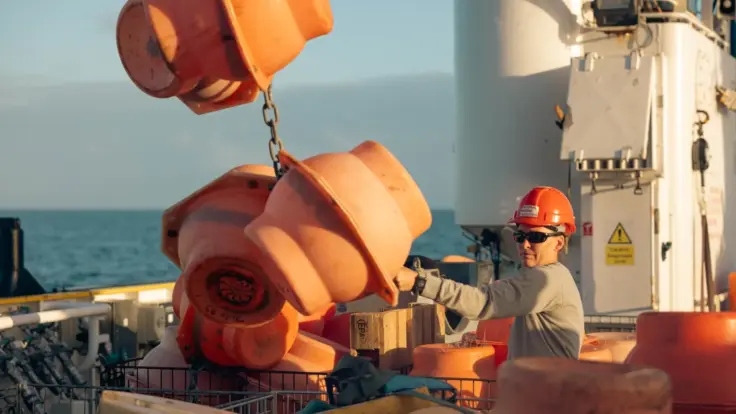
Oceanographers use a unit called the Sverdrup (Sv) to describe the volume transport of water. One Sverdrup is 1 million cubic metres of water per second. Today, the RAPID array estimates the AMOC’s strength at about 17 Sv. That’s equivalent to roughly 6,800 Olympic-sized swimming pools of water being redistributed through the Atlantic every second, with warm surface waters flowing north and colder deep waters returning south.
A stunning number. But is it falling over time?
Scientifically, the jury’s still out. The RAPID array has observed weakening – but longer series of data are needed, because we can’t say whether this is evidence of a multi-decade slowdown of the AMOC or just natural variation. Longer time series and new approaches will be needed to determine if this phenomenon is caused by human activity – and BAS researchers are working on one such contribution.
It’s called “OceanBound” and its core idea is very simple. If you measure the pressure of the water pressing down on the seafloor on either side of the Atlantic Ocean basin, the difference between those two numbers tells you how much water is flowing between them — without ever going near the middle.
“It’s about boundary pressure,” explains BAS oceanographer Dr Emma Boland. “Instead of thinking, well, we’re interested in transport, let’s go measure the transport – we start from the boundaries and ask what’s influencing those.”
So how does the middle of the ocean “talk” to the edges? Imagine a gust of wind blowing over open water, nowhere near land. It disturbs the sea surface, creating a kind of wave that radiates outward — sometimes taking days, sometimes years, to cross the basin. When that disturbance finally reaches a coastline, it nudges the height and density of the water there, ever so slightly. That nudge changes the pressure.
And the difference in pressure between one side of the ocean and the other is what drives water to flow north or south between them. The result, Emma and her colleagues believe, is a very practical way to keep watch on a current as vast as the AMOC.
Many of the seafloor pressure gauges lining the near-coastal areas of the Atlantic weren’t actually built with the AMOC in mind at all. They were put in place for general oceanography and meteorology purposes, or to monitor for earthquakes and tsunamis. But – as they like to say – one person’s noise is another person’s signal.
Early results from the project are striking. The team has recovered 80-90% of the RAPID array’s transport record using nothing but pressure readings and basic physics. To dig into cause and effect, the team runs what’s called an adjoint model. Ordinarily, a model looks forward: feed in today’s winds and currents, and it predicts what the ocean will do next. An adjoint model runs the whole thing in reverse. Start with today’s pressure signal and the model traces it backwards through time, peeling back layer after layer of cause and effect until it arrives at the winds and heat fluxes that set it all in motion — sometimes years earlier, since the ocean takes its time to respond.
“It runs backwards and traces the equations,” says BAS’s Dr Andrew Styles. “We can say, well, that tells us where the winds were blowing that then influenced that pressure at a later time.”
The approach has already picked out specific wind and heat patterns that explain most of the year-to-year wobble in the AMOC’s strength. OceanBound shows again how pathways to developing early warning systems could eventually open up.
“But this is very early-stage; we’re quite a few steps away from that,” cautions Emma. “What we’ve confirmed really nicely here is that we can use these methods to find causal chains.”
Back in Cambridge, Mike is thinking big about the next generation of physical instruments to complement the new models.
He’d like to see fleets of autonomous vehicles, gliders and floats, deployed not by the dozen but by the thousand, all steered in real time by AI, hunting for the earliest signs of change. Rather than fixed moorings that log the same patch of ocean year after year, we’d move to a roving network that goes wherever the science says to look next — a system capable of redirecting itself the moment something interesting turns up.
It’s an ambitious vision, but for Mike, it’s the only response that matches the scale of the question.
“That’s the next frontier for big ocean observing systems. We need to get this right,” he says, tapping his map one last time. “Really hard problems.”