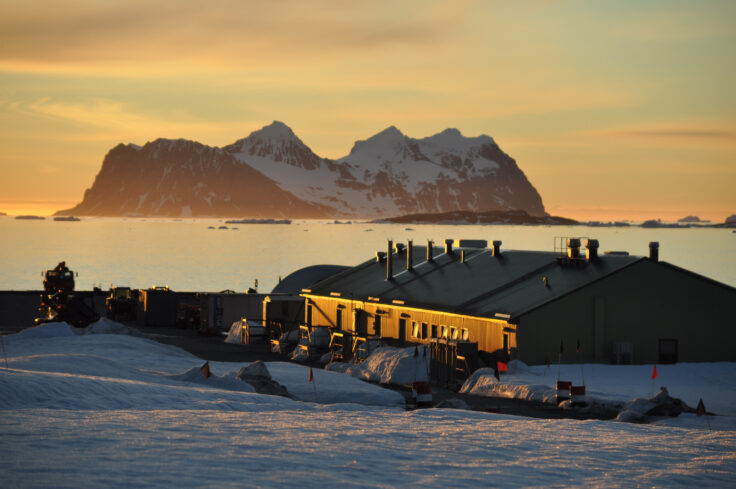
It is 8.30 in the morning at Rothera Research Station, and the marine team is gathered for its daily briefing. Outside, Ryder Bay stretches into a pewter Antarctic sky. Someone checks the weather. Someone else has checked sea ice conditions. Within fifteen minutes, a decision has been made: it’s a RaTS day.
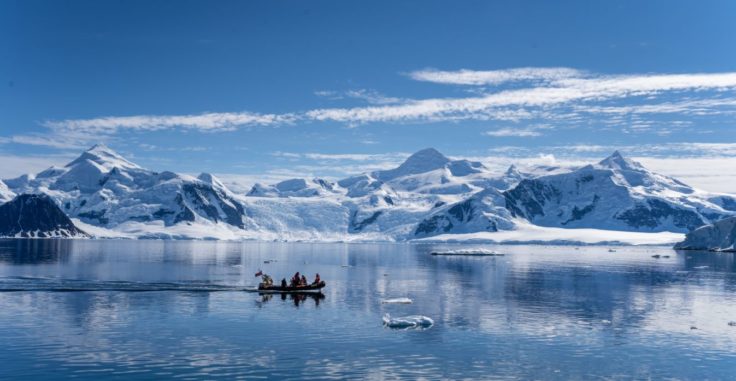
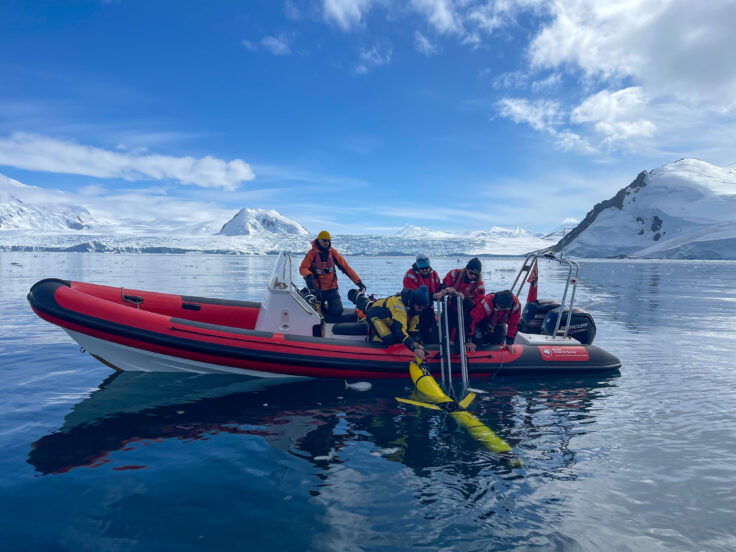
The Rothera Time Series (or RaTS) has been running since 1997. Every five to seven days, weather and ice permitting, a small rigid inflatable boat pushes out from the station ramp into Ryder Bay, laden with Niskin bottles, a CTD instrument. The team is measuring the biochemistry of the water column that plunges hundreds of metres beneath them. They have been doing this, in one form or another, for nearly three decades.
What they are building is one of the most significant sets of long-term ocean measurements in Antarctica, and a near-unique record for winter at either pole.
The seas around Antarctica are climatically very important, as they are closely connected to the rest of the world world’s oceans. In a region that scientists describe as the most rapidly warming in the Southern Hemisphere — where atmospheric temperatures rose by almost 0.4°C per decade in the second half of the twentieth century and summer ocean surface temperatures have increased by more than 1°C — it’s a data record has never mattered more.
Out on the water
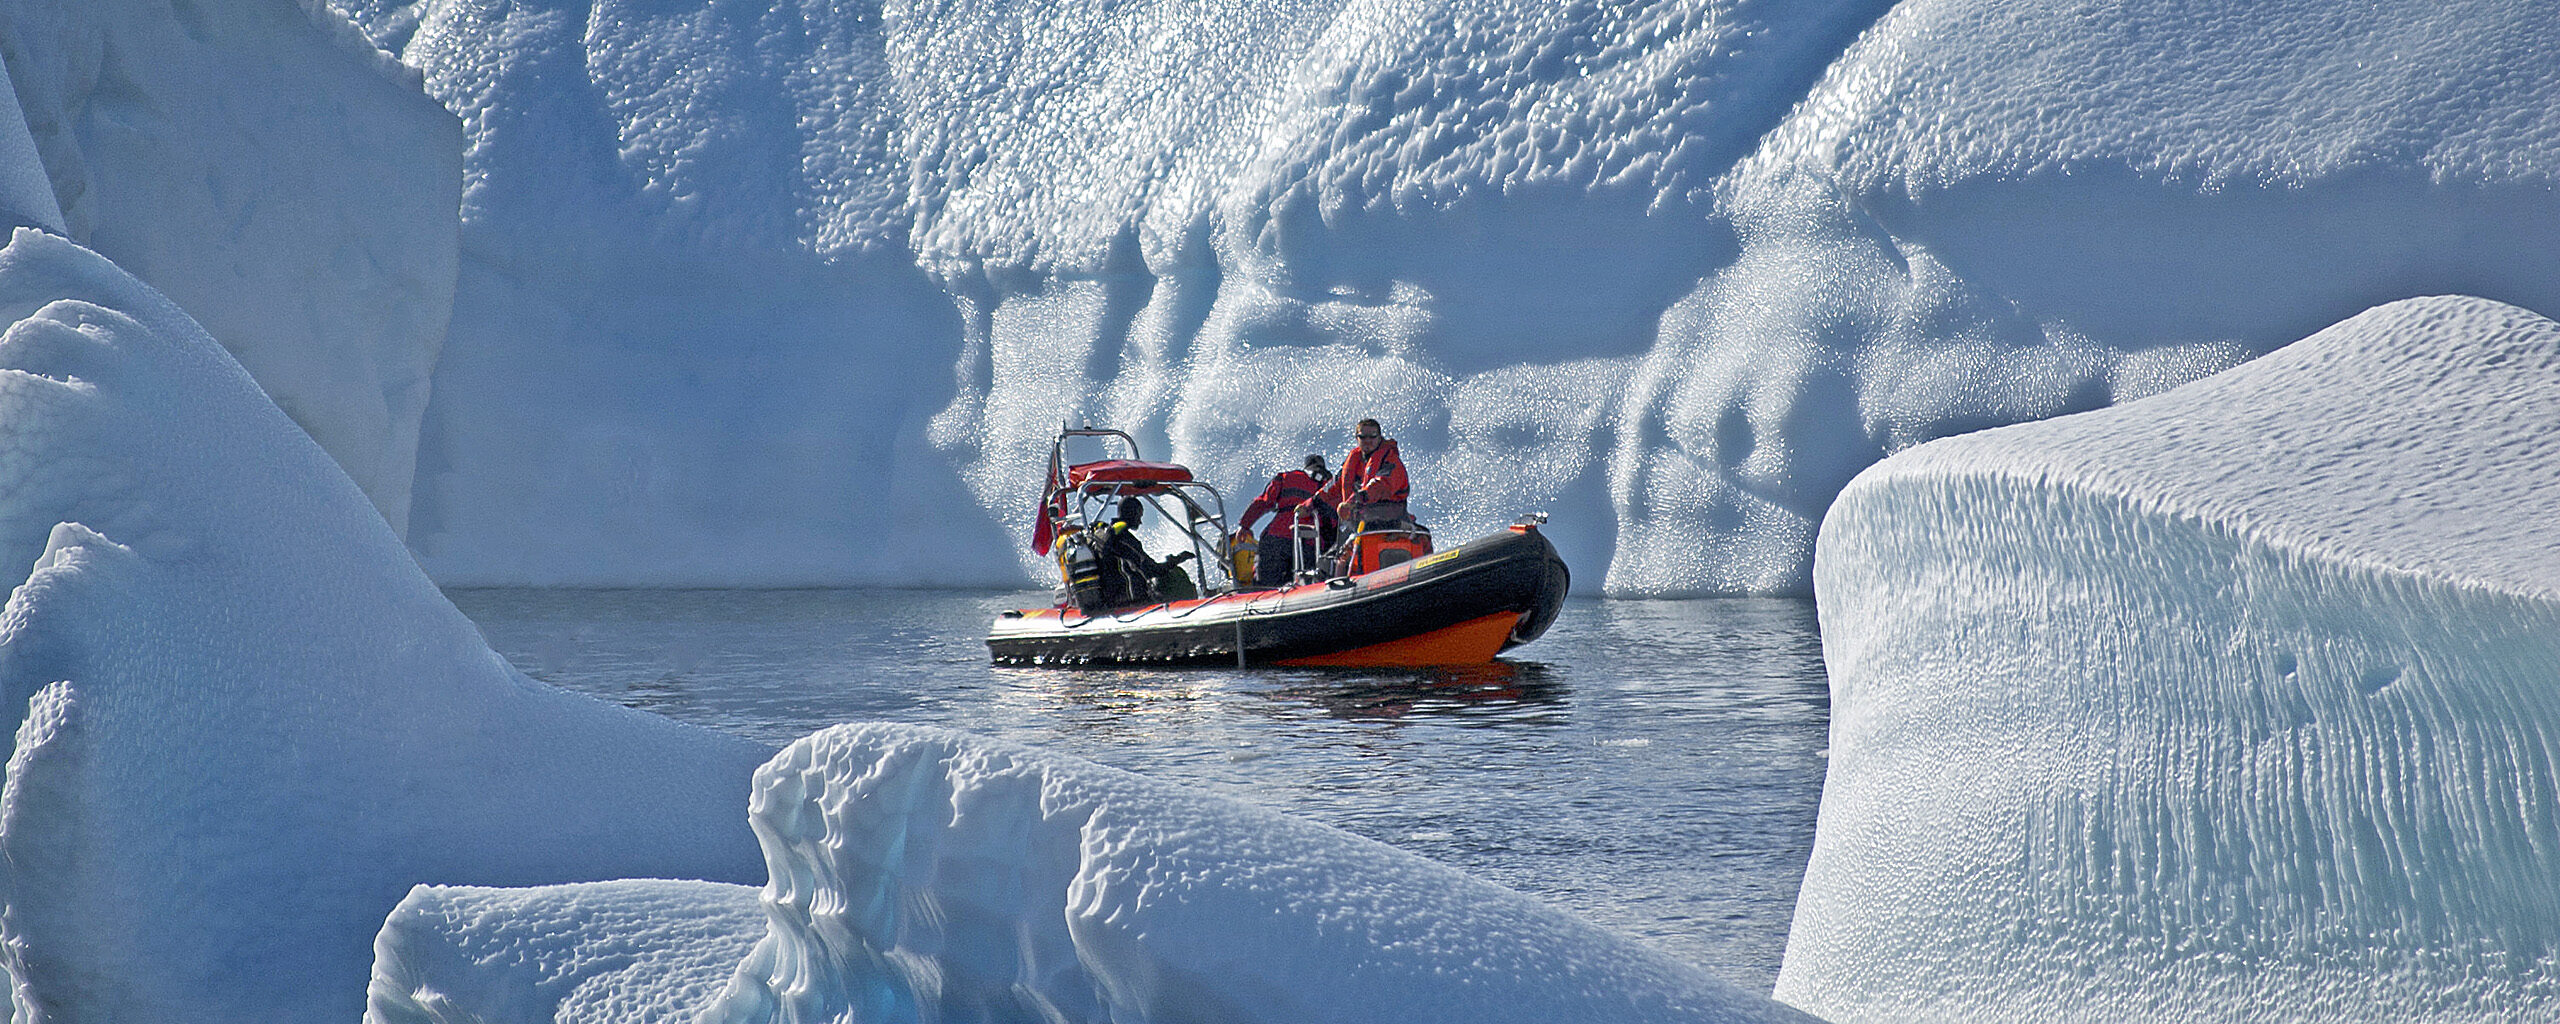
On a good day, the briefing finishes up quickly. Equipment is prepared, the boat is craned into the water, and by somewhere between nine and half past the team is out on Ryder Bay. The primary sampling site sits in the middle of the bay, and the journey itself is never quite the same twice.
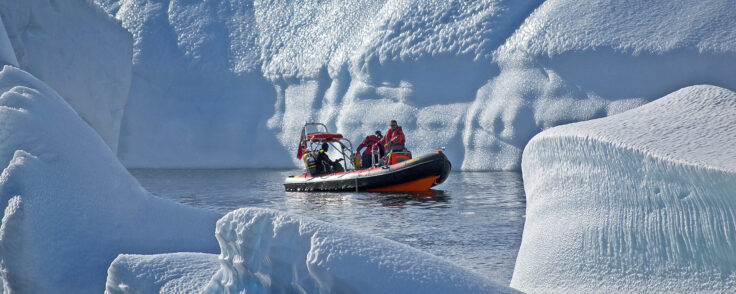
“On a nice day where there’s no ice, you’re there real quick,” says Eva Riehle, Bonner Lab Manager and marine team lead at Rothera. “You can just go and straight-line-it there. On some days it takes you 45 minutes, just because there’s ice and you need to go really slow weaving your way through it.”
Once there, the work is methodical. The CTD is lowered on a manual winch through the water column, sometimes to depths of 500 metres or more, to measure temperature, salinity, density, fluorescence, and light as it descends. Niskin bottles collect discrete water samples. Back on land, these will be analysed for macronutrients, chlorophyll, dissolved oxygen, isotopic tracers of ice melt, carbonate chemistry, and microbial communities — a suite of measurements that, linked with the atmospheric and sea ice observations maintained continuously at the station, makes RaTS one of the most comprehensive ocean time series programmes anywhere in the Southern Ocean.
Winter measurements also have the added complication of sea ice, which needs to be thick enough to walk on and cut through safely; or to be loose enough to safely nudge past in the boat. Allie Clement spent several seasons as Ocean Scientist at Rothera before moving into their current role as Science Coordinator and Meteorologist.
“Some years, there’s long times when it’s too thick to put a boat in the water but too thin to stand on,” Allie says, “and you just have months of not being able to sample anything. Sea ice has definitely changed its trends. It feels like… well, we’re getting less sea ice. Actually the worst sea ice year we had a couple of years ago was the best sampling year we had, because we got underwater more.”
Some tests take 12 or 24 hours to produce a result, meaning the following day begins back in the lab. In summer, when phytoplankton is abundant, filtering water samples is relatively quick, but winter is a different story. “In the winter, there’s very little phytoplankton,” Allie adds. “So you’re filtering a lot of water. When you say the Ocean Scientist just goes off into the lab and does their sampling — that can mean like a 10pm or 11pm finish because you’re just staring at water dripping through.”
If completing weeks and months of the same measurements sounds like it could get boring, both Allie and Eva say the opposite.
“I found it really satisfying to get quite slick at it,” says Allie. “And I also really enjoyed having a purpose and something to do over the winter months. The boating side of it… every condition is different every day. You’ll see something different, you’ll be with a different person, or you’ll be in a different role on the boat and the ice is different. The lab side of things, it’s repetitive, but I just enjoyed that because I got quite smooth at it.”
What the data is telling us
One of the biggest questions polar oceanographers are addressing is how much CO₂ the oceans will absorb in the future. At the moment, the global ocean picks up about a quarter of all CO₂ that humans emit, and about 40% of that is in the Southern Ocean.
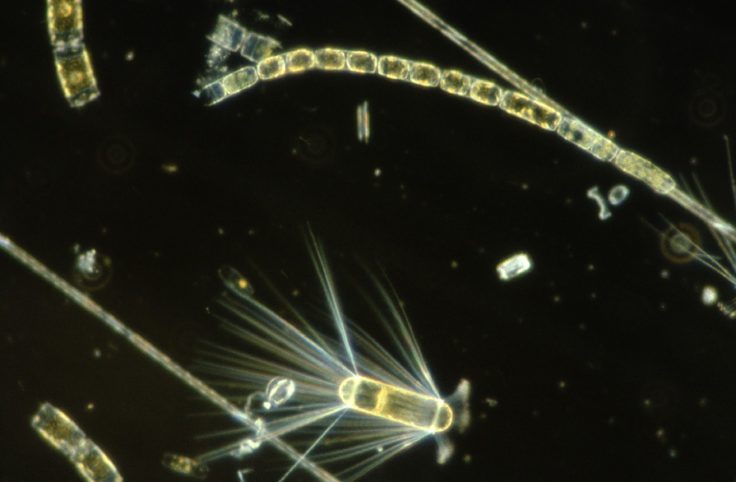
Ryder Bay has a dramatic seasonal cycle. Over winter, sea ice forms a lid over the ocean, trapping nutrients beneath the surface. When the ice melts in spring, in concert with the return of 24-hour daylight, those accumulated nutrients are suddenly released, and phytoplankton blooms with extraordinary intensity.
The resulting explosion of microscopic plant life feeds krill, which in turn feeds penguins, seals, and whales. “There isn’t really another food source except in the ocean,” says Eva. “That’s the only thing that everything can feed on.”
Two important indicators the RaTS team look for are chlorophyll and ammonia. Chlorophyll is the pigment that most phytoplankton use to photosynthesise — a proxy for how much plant life is in the water. Ammonia is the breakdown product when that photosynthesis starts to decline. Together, they reveal where phytoplankton is in its cycle, and what the ocean around them is doing.
“You can tell a lot from where the phytoplankton is in the bloom,” says Allie. “It’s very similar to looking at the state of your lawn. If it’s super green and lush, that’s because it’s had a lot of nutrients and a lot of sunlight — it’s healthy. If you’re starting to get patches or no growth, that’s because it’s lacking in something. That’s exactly the same concept in the ocean.”
This is where the length of the RaTS time series becomes genuinely irreplaceable. Its weekly sampling frequency builds up a detailed, long-term picture that shorter studies simply cannot match. It captures not just whether blooms are occurring, but when they start and end, how deep in the water column phytoplankton concentrates, and how all of this is shifting year on year.
The findings that have emerged from that sustained attention are striking. Scientists have detected new feedbacks between the ocean, ice, and atmosphere — with implications for the rest of the Southern Ocean as climate change progresses.
One major finding revealed by the RaTS data is a decline in ocean phytoplankton over the course of decades, driven by changes in ocean structure caused by sea ice loss. This summer phytoplankton boom is the main mechanism that helps the ocean store CO₂. The finding is a warning that extends far beyond Ryder Bay: as sea ice disappears across the Southern Ocean in the coming decades, it’s likely we’ll see similar patterns.
Meanwhile, separate analysis of the RaTS data has shown how winter sea ice determines how much of that carbon is actually retained by the ocean. Dr Elise Droste, a Marine biogeochemist at the University of East Anglia, concluded that the ocean absorbed 20% more CO₂ from the atmosphere when winter sea ice lasted longer, than in years when sea ice formed late or disappeared early. As well as acting like a cap that prevents interaction between water and air, the sea ice also protects the ocean from strong winter winds that drive mixing between the surface of the ocean and its carbon-rich depths.
The data has also shown that the ocean around the Antarctic Peninsula is sensitive to large-scale global climate patterns, including El Niño and the Southern Oscillation — meaning that what happens in the tropics can be felt in the water column at Rothera.
Improving the picture
But what does this tell us about the Southern Ocean’s future behaviour and the timeline for change? These are not straightforward questions to answer, and the team are careful about the limits of what observation in this one area can prove. Allie reframes this problem of attribution and complex systems in terms of some of Rothera’s biggest and most popular visitors:
“It’s really difficult,” says Allie, “because there are just an unbelievable amount of variables. For example, we are generally seeing a lot more whales at Rothera. We’re also seeing a decline in sea ice. We’re also seeing the longest time since whaling has stopped. How do you know which one’s changing and which one’s affecting it?”
A key data gap that the RaTS team are working to fill is sampling the sites further away from Rothera along the Peninsula during the winter.
This is an area where new technologies are helping to expand the ambition of the time series: monitoring the wider bay and region with instruments that operate day and night, in conditions that would keep any boat ashore. There have now been several seasons of deployments using autonomous ocean gliders, developed in partnership with the National Oceanography Centre and Teledyne Webb Research. But the ambition of the project leaders is even greater: a fully-fledged UK Southern Ocean Observatory, built on the foundation of the time series, using smart moorings and new technology assets to understand this region of rapid change with ever-greater depth and precision.
Context that matters
RaTS is the backbone of what happens in Ryder Bay, but it is far from the whole body. The data set functions as a permanent context for a wide range of additional science — from the marine team’s own parallel monitoring programmes to visiting researchers from universities and international partners who arrive with their own grant-funded projects.
“Whenever they win grants and come in to look at some specific process in the ocean — silicon cycling, manganese cycling, iron cycling — it’s always linked to RaTS,” says Eva. “And that is really valuable. It makes the RaTS data more valuable because it uses it, but it also gives their own project some sort of context.”
Some of those contextual data streams sound simple, but are vital. Daily sea ice observations, maintained without interruption across the full life of the programme, mean that nobody has to rely on memory to reconstruct conditions from two winters ago. Weekly wildlife counts log the presence of penguins, whales, and seals in the bay — not as a formal ecological survey, but as a running record that, over decades, starts to tell its own story.
“There’s all sort of bits and bobs recorded alongside the main ocean chemistry,” says Eva. “They gain value as observations by having that data set in the first place. Like we know about animals there, or plankton here… and stand-alone they might not be able to tell you much. But we always have it alongside the big ocean science data set, which allows you to spot long-term patterns in things that you’re looking at. It’s quite cool.”
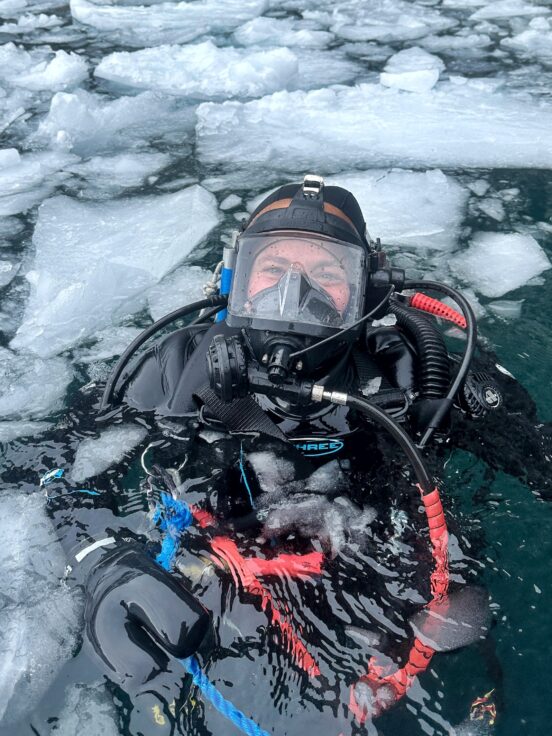
Then there is the diving programme. Once a month, the team descends to two sites around the station to collect small seabed creatures for laboratory analysis. The central question is reproduction: how well are these animals coping, season to season and year to year? Monthly collections over years and decades begin to reveal how conditions in the water column translate into outcomes on the seafloor.
Alongside this sits the IceBergs Impact Study (IBIS) which monitors the damage done to the seabed when icebergs drag across it, and the pace at which those communities recover. In a warming ocean, where icebergs are more numerous and mobile, understanding those recovery rates is becoming increasingly urgent
“That’s a really good example of ocean floor recovery,” says Allie. “When the icebergs come along, they’ll completely scour the floor. And we can look at different parts of that survey and say, well, this place hasn’t been scoured for ten years — what does it look like compared to this place that’s been scoured last week?”
All of this connects outward. RaTS is operated by BAS but is a genuinely UK-wide programme, with partners from the universities of East Anglia, Southampton, Edinburgh, Oxford, and Bristol, as well as the National Oceanography Centre and the British Geological Survey. Internationally, it is a key UK contribution to the US-led Palmer Long-Term Ecological Research programme further north on the Antarctic Peninsula; enabling equipment cross-calibration, shared expertise, and significantly enhanced scientific reach. Dutch Antarctic programme funding has also enabled development of the RaTS collaboration along avenues that would not otherwise have been possible.
A special kind of continuity
Sustaining a monitoring programme across nearly three decades requires more than good science. It requires people willing to work long and sometimes unglamorous hours, to exercise judgement in a constantly changing environment, and to hand something precious on to the next person without hesitation.
“It’s never your data set,” says Allie. “You’re just the person looking after it for that time being. It felt fine to hand it over because I knew I was handing it over to someone who was as passionate about caring for it. We generally get people that really care about that role.”
That care runs through the whole culture of the station. Eva describes Rothera and the ocean science roles as attracting “quite a lot people who really want to be there. And often they come back, season after season.” There are Rothera veterans who keep coming back, she says, “and it’s because we really do care about the place. We really do want to make it nice, and make it better, and make it good for everyone.”

The learning curve for new arrivals is steep. Questions come thick and fast for the first months, then gradually subside as the teams become expert.
“When they get there, it’s quite a relief from all sides,” says Eva, “because they’re like ‘nice, I am the expert, I know what I’m doing’. And by the time they’ve done it for a while, it’s almost time to teach a new person again.”
There is a photograph somewhere in the Bonner Laboratory in which seven former Ocean Scientists are on the station at the same time — one still in post, the others having moved on to other roles at BAS and beyond. It is an image that captures that the programme is bigger and longer than any individual’s involvement in it, and that the people it has drawn in have tended to stay close.
The RaTSdata set itself is all available through the Polar Data Centre, making it citable by other researchers. Allie used it themselves for a side project during their time as Ocean Scientist, checking about working with the chlorophyll data from one of the programme leads, Professor Kate Hendry. “She was like, yeah, go for it,” they recall. Everyone who has lead on collecting this data is listed as a author. “It’s sort of comical,” says Allie. “You look at it and you’re like: that is a lot of names for a paper.”
And for all the repetition, for all the late nights staring at samples dripping through a filter, the work carries its own rewards. Out in the bay, no two days are the same. The ice shifts, conditions change, and the wildlife appears without warning.
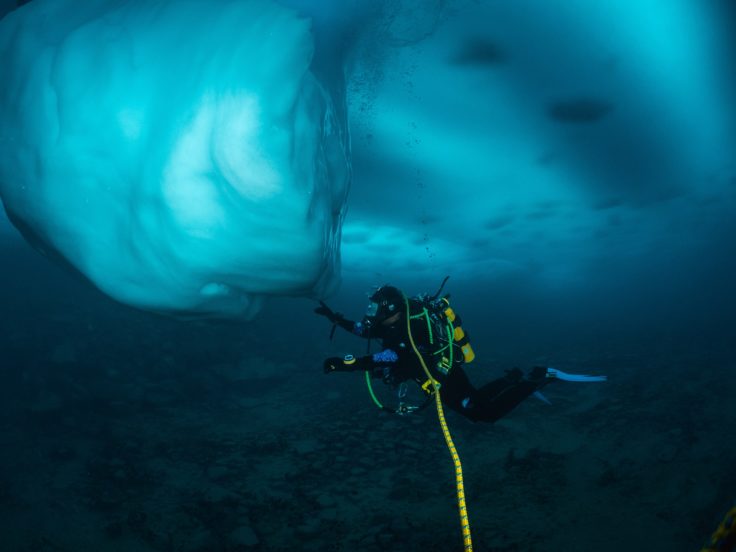
“You’ll go out,” says Allie, “and you’ll have a day where you’re having to dodge whales to come back in because there are so many. And that starts to be your normal summer. It’s crazy.” Their most vivid memory, though, comes from beneath the surface — an ice dive in the middle of winter.
“The twilight light is really beautiful. It’s absolutely freezing and you can only dive under the ice on calm days. When you actually get under there, there are all these incredible blues and greens of algae stuck to the top of the ice ceiling.”
“I’ve been really lucky in that some of the ice dives I had, you could hear Weddell seals – they sound like they’re from outer space when they’re underwater. They do these incredible clicks and whizzes and sonic noises. And then we had a group of maybe ten crabeater seals just come and hang out on the dive with us, literally following our air bubbles under the ice. I have no idea where they came from or where they went. I got out of there and I was like: that’s never going to be topped.”